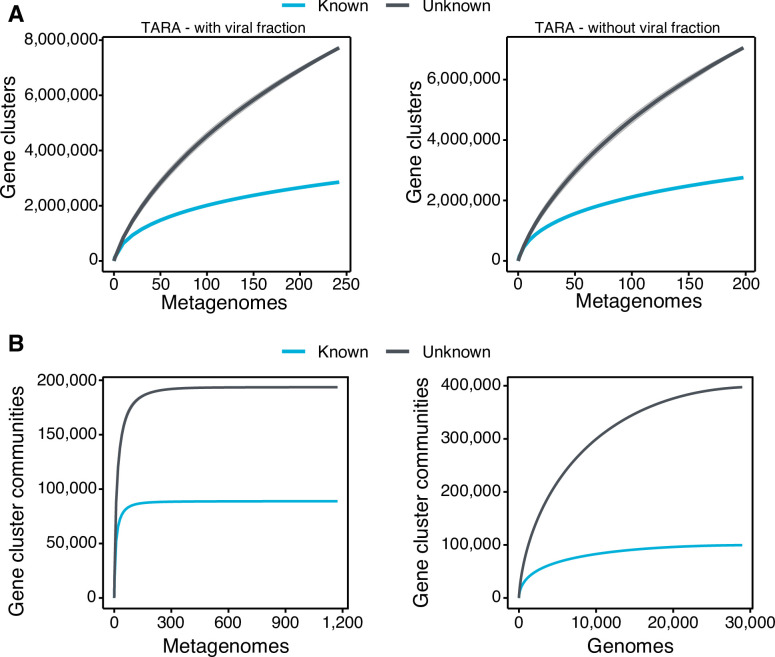
Appendix 1—figure 4. Collector curves for the known and unknown sequence space.
(A) Collector curves at the gene cluster level, for the TARA metagenomes, including the viral fraction (left) and excluding it (right) from the analysis. (B) Collector curves at gene cluster community level for the metagenomes from TARA, MALASPINA, and HMP-I/II projects (left) and the 28,941 GTDB genomes (right).

