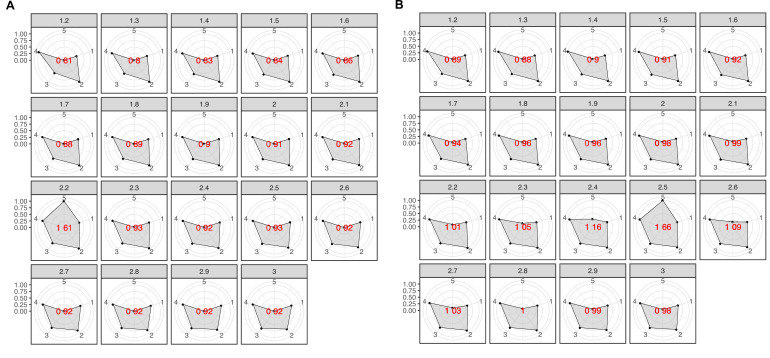
Appendix 7—figure 1. Radar plots used to determine the best MCL inflation value for the partitioning of the K into cluster components.
The plots were built using a combination of five variables: 1 = proportion of clusters with one component and 2 = proportion of clusters with more than one member, 3 = clan entropy (proportion of clusters with entropy = 0), 4 = intra HHblits-Score/Aligned-columns (normalized by the maximum value), and 5 = number of clusters (related to the non-redundant set of DAs). (A) Metagenomic dataset. (B) Genomic dataset.

