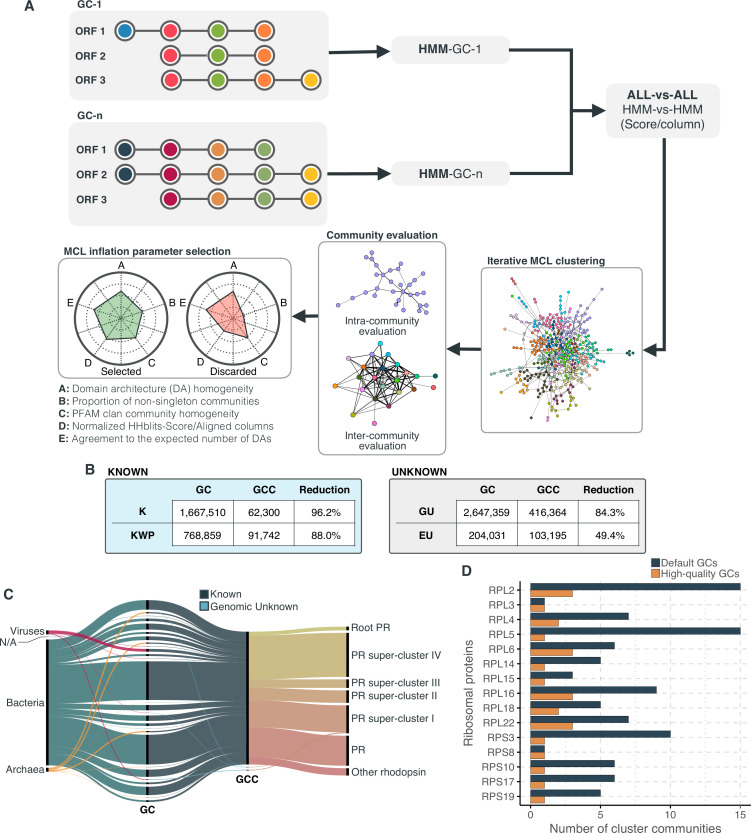
Figure 2. Overview and validation of the workflow to aggregate GCs in communities.
(A) We inferred a gene cluster homology network using the results of an all-vs-all HMM gene cluster comparison with HHBLITS. The edges of the network are based on the HHblits-score/Aligned-columns. Communities are identified by an iterative screening of different MCL inflation parameters and evaluated using five different metrics that consider the inter- and intra-community properties. (B) Comparison of the number of GCs and GCCs for each of the functional categories. (C) Validation of the GCCs inference based on the environmental genes annotated as proteorhodopsins. Ribbons in the alluvial plot are genes, and each stacked bar corresponds (from left to right) to the (1) gene taxonomic classification at the domain level, (2) GC membership, (3) GCC membership and (4) MicRhoDE operational classification. (D) Validation of the GCCs inference based on ribosomal proteins based on standard and high-quality GCs.

