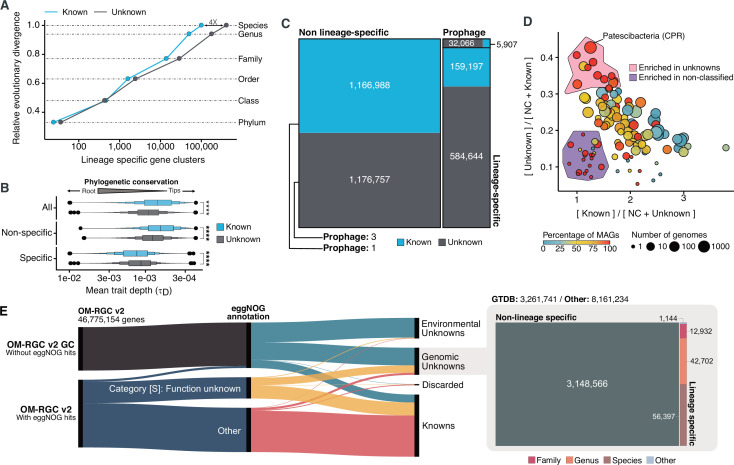
Figure 5. Phylogenomic exploration of the unknown sequence space.
(A) Distribution of the lineage-specific GCs by taxonomic level. Lineage-specific unknown GCs are more abundant in the lower taxonomic levels (genus, species). (B) Phylogenetic conservation of the known and unknown sequence space in 27,372 bacterial genomes from GTDB_r86. We observe differences in the conservation between the known and the unknown sequence space for lineage- and non-lineage specific GCs (paired Wilcoxon rank-sum test; all p-values < 0.0001). (C) The majority of the lineage-specific clusters are part of the unknown sequence space, and only a small proportion was found in prophages present in the GTDB_r86 genomes. (D) Known and unknown sequence space of the 27,732 GTDB_r86 bacterial genomes grouped by bacterial phyla. Phyla are partitioned based on the ratio of known to unknown GCs and vice versa. Phyla enriched in MAGs have higher proportions in GCs of unknown function. Phyla with a high proportion of non-classified clusters (NC; discarded during the validation steps) tend to contain a small number of genomes. (E) The alluvial plot’s left side shows the uncharacterized (OM-RGC v2 GC) and characterized (OM-RGC v2) fraction of the gene catalog. The functional annotation is based on the eggNOG annotations provided by Salazar et al., 2019. The right side of the alluvial plot shows the new organization of the OM-RGC v2 sequence space based on the approach described in this study. The treemap in the right links the metagenomic and genomic space adding context to the unknown fraction of the OM-RGC v2.

