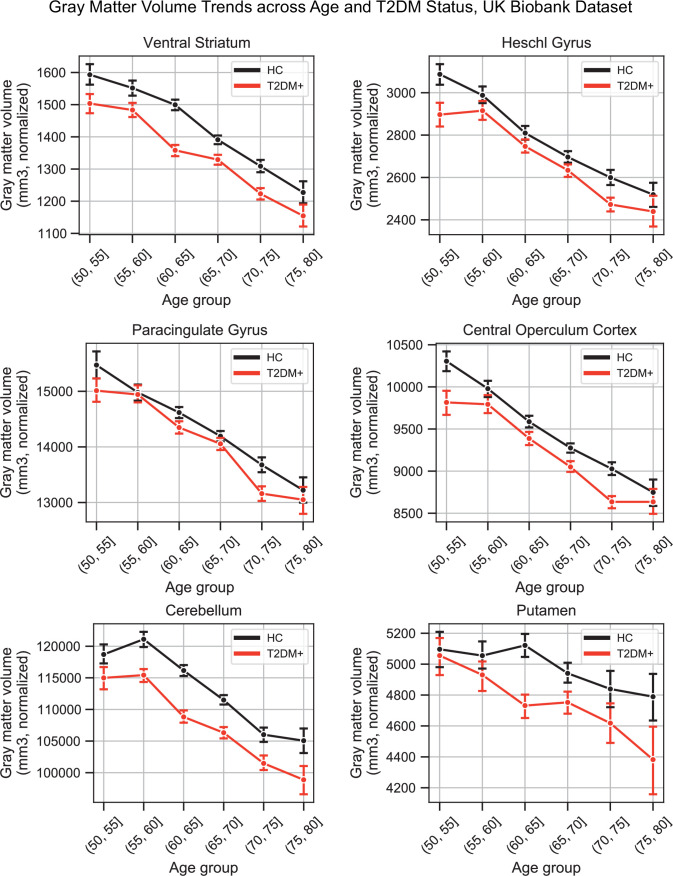
Appendix 1—figure 5. Plots representing trends across age and type 2 diabetes mellitus (T2DM) for six regions that exhibited the strongest trends in gray matter volume changes.
The linear trends across age were robust and justified modeling age as a linear factor. The apparent deviation from linear trends in the youngest and oldest age groups is explained by markedly smaller sample sizes in those age groups (see underlying sample sizes in Appendix 1—figure 1A).

