. 2022 May 24;11:e73138. doi: 10.7554/eLife.73138

Figure 1. Cognitive deficits are apparent with respect to both age and type 2 diabetes mellitus (T2DM) diagnosis.

(A) Using the UK Biobank dataset, we performed a quantitative analysis of the effects related to age on cognitive performance across five cognitive domains. Associated changes were derived from estimated regression coefficients as percentages and are shown on the y-axis. Age was associated with significant deficits in all five domains, with the strongest effects observed in executive function and processing speed. (B) Using the same dataset, we also analyzed cognitive performance in T2DM, with negative values on the y-axis representing performance below that of age-, sex-, and education-matched healthy controls (HCs). As per age effects, executive function and processing speed showed the highest magnitude changes. (C) Cognitive deficits identified in UK Biobank data were confirmed by our meta-analysis, which included 11 domains from 34 studies. Average effect sizes (Cohen’s d) corresponding to T2DM are shown on the y-axis. Values below the cutoff line (y = 0) indicate cases in which subjects with T2DM performed less well than age- and education-matched HC. Numbers next to labels identify domains common across panels. Marker sizes represent sample sizes scaled (per area) as indicated in the bottom-right corner of each panel. On panel (C), sample size indicates the number of individual studies. Underlying sample size distributions can be found in Appendix 1—figures 1C and 2C. Error bars are 95% CI. *p≤0.05; **p≤0.01; ***p≤0.001, Bonferroni corrected.

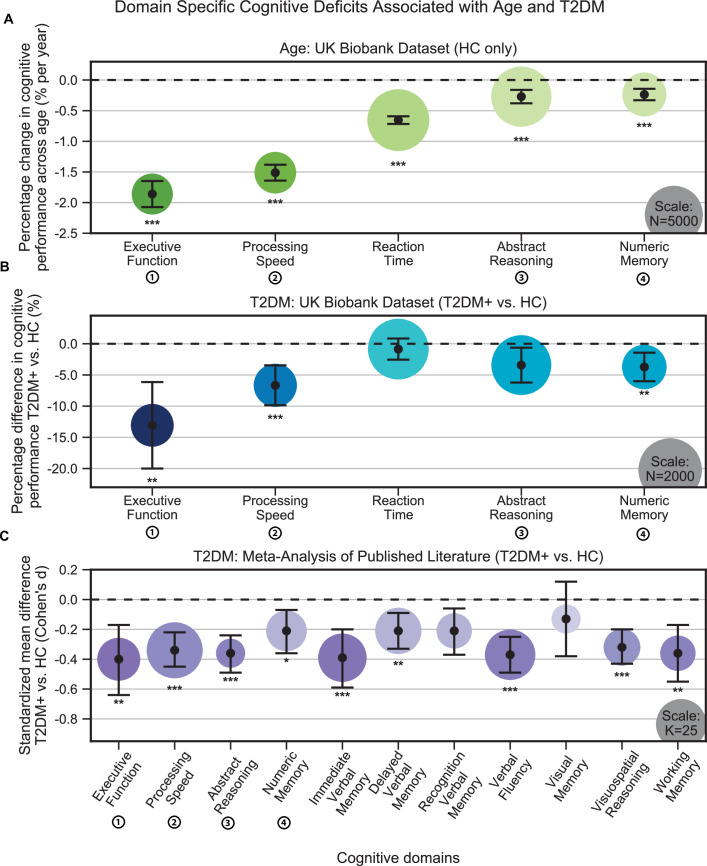
Figure 1.

Figure 1—figure supplement 1. Cognitive differences associated with sex in the UK Biobank dataset across the five cognitive domains.

Figure 1—figure supplement 1.

Samples were healthy controls (HCs) only and were matched for age, education, and hypertension. Values on the y-axis represent % difference in performance compared to the combined average (from both females and males). A positive % represents better performance in males. Marker sizes represent sample sizes scaled (per area) as indicated in the bottom-right corner. Error bars are 95% CI. *p≤0.05; **p≤0.01; ***p≤0.001, Bonferroni corrected.
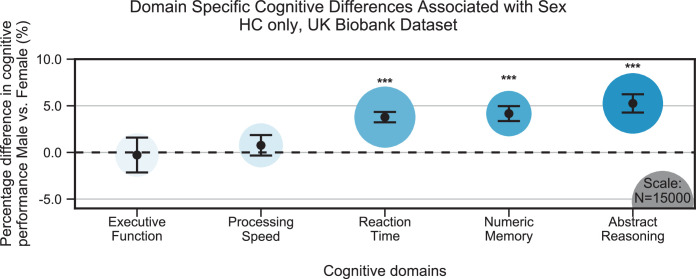
Figure 1—figure supplement 2. Cognitive differences associated with age (A) and type 2 diabetes mellitus (T2DM) (B) in the UK Biobank dataset across the five cognitive domains, analyzed separately within males and females.

Figure 1—figure supplement 2.

Samples were matched for age, education, and hypertension. The associated effects were consistent across males vs. females, but with respect to T2DM, effects were generally stronger in males. Note that sample sizes were significantly larger for males compared to females. Marker sizes represent sample sizes scaled (per area) as indicated in the bottom-right corner of each panel. Error bars are 95% CI. *p≤0.05; **p≤0.01; ***p≤0.001, Bonferroni corrected.
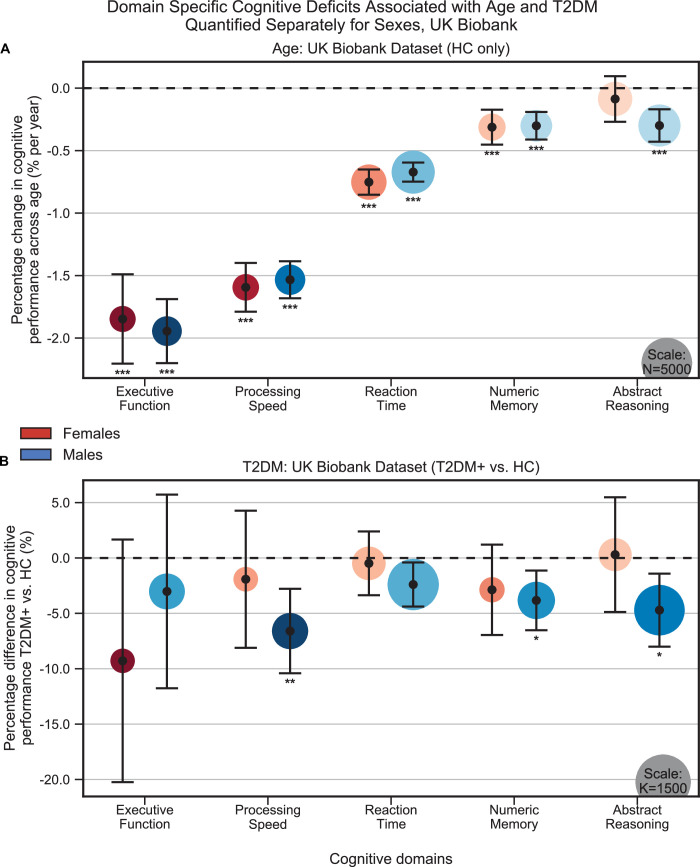
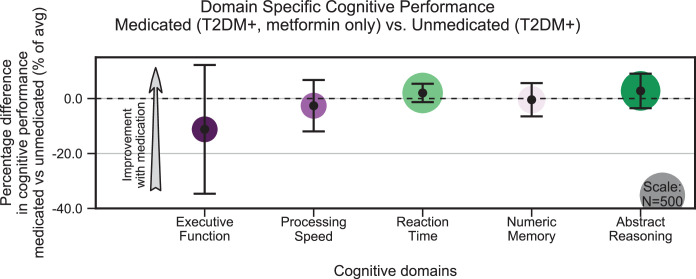
Figure 1—figure supplement 3. Treatment of type 2 diabetes mellitus (T2DM) patients with metformin had no impact on cognitive deficits.

Figure 1—figure supplement 3.

We evaluated the UK Biobank dataset to determine whether treatment with metformin would prevent the development of cognitive deficits associated with T2DM. Among T2DM-diagnosed subjects only, we compared those subjects who reported using metformin but no other medications to those who reported not taking any medications to treat T2DM. We matched subjects for age, sex, education, and T2DM disease duration, and controlled for body mass index (BMI). No statistically significant (α = 0.05) differences in cognitive performance were detected when comparing subjects on metformin to unmedicated subjects (arrow indicates the direction of expected improvement by metformin). Underlying sample size distributions can be found in Appendix 1—figure 7C. Error bars are 95% CI.