. 2022 May 24;11:e73138. doi: 10.7554/eLife.73138

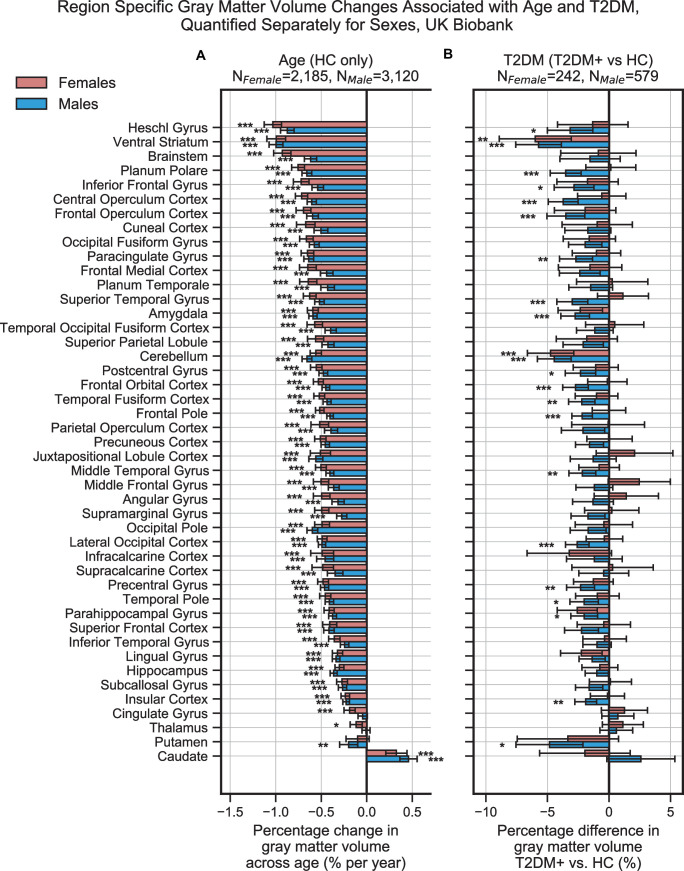
Figure 2. Widespread gray matter atrophy can be observed with respect to both age and type 2 diabetes mellitus (T2DM) diagnosis status.

Using the UK Biobank dataset, we measured gray matter atrophy across 45 anatomical regions. Associated changes were derived from estimated regression coefficients as percentages and are shown on the x-axes. (A) We observed significantly decreased gray matter volume in both cortical and subcortical brain regions with respect to age in healthy controls (HCs). Age was associated with an average of ~0.5% brain-wide decrease in gray matter volume per year, most prominently for the ventral striatum and Heschl’s gyrus. (B) Gray matter atrophy was also seen in patients diagnosed with T2DM compared to age-matched HC, most prominently for the ventral striatum, cerebellum, and putamen. The distribution of T2DM-related effects overlapped with those associated with age, with degeneration of the ventral striatum and preservation of the thalamus and caudate. Underlying sample size distributions can be found in Appendix 1—figures 1A and 2A. Error bars are 95% CI. *p≤0.05; **p≤0.01; ***p≤0.001, Bonferroni corrected.

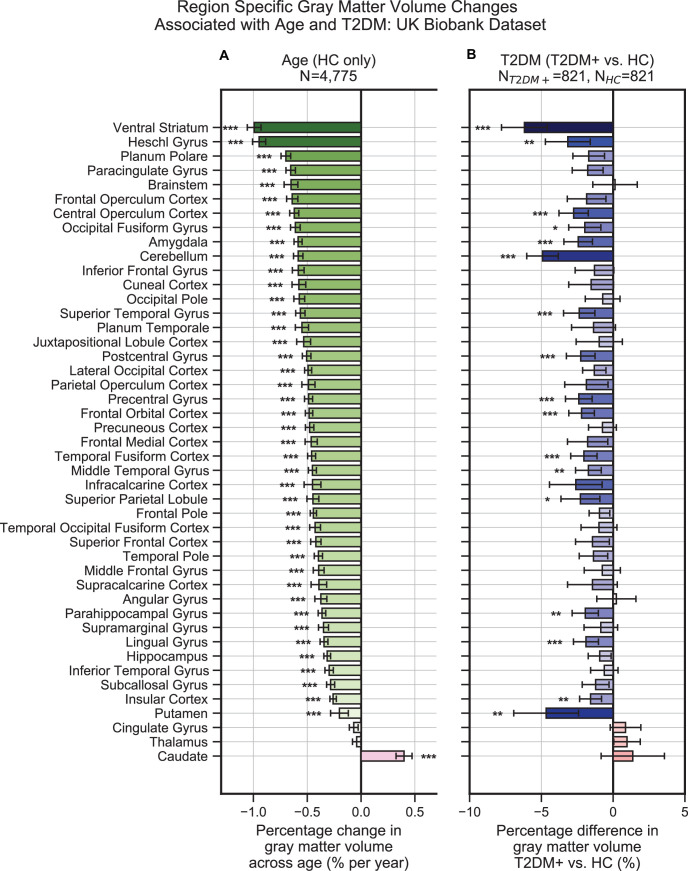
Figure 2.

Figure 2—figure supplement 1. Effects of age and type 2 diabetes mellitus (T2DM) exhibited strong correlations within datasets and modalities.

Figure 2—figure supplement 1.

We considered six sets of changes we previously characterized in association with the following: (1) age contrast, gray matter volume in UK Biobank; (2) T2DM contrast, gray matter volume in UK Biobank; (3) age contrast, brain activation in UK Biobank; (4) T2DM contrast, brain activation in UK Biobank; (5) age contrast, brain structure/activation (aggregate) from NeuroQuery; and (6) T2DM contrast, brain structure/activation (aggregate) from NeuroQuery. Corresponding effects from region-/domain-specific analyses were considered as inputs for correlation measures, which were then determined for all combinations of the six sets of effects. Age and T2DM were significantly correlated (Pearson’s r) within all modalities, suggesting common trajectories between age- and T2DM-related effects. No other significant correlations were observed, however, between datasets or modalities. Given that structural and functional effects appeared to be unrelated within UK Biobank, and that the NeuroQuery results were a combination of both structural and functional results, we did not expect significant associations between modality-specific UK Biobank results and multimodal (structural and functional) NeuroQuery results. However, it is important to note that very different ways of acquiring and analyzing brain data independently replicate the correlations between age- and T2DM-related effects, suggesting that the association is highly robust. See relevant scatterplots in Figure 2—figure supplement 2. *p≤0.05; **p≤0.01; ***p≤0.001, Bonferroni corrected.
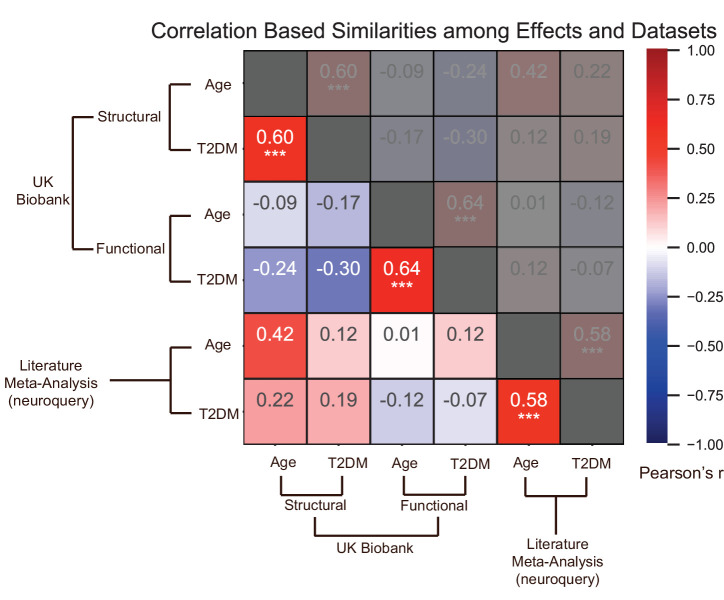
Figure 2—figure supplement 2. Scatterplots corresponding to the statistically significant cells in Figure 2—figure supplement 1.

Figure 2—figure supplement 2.

Statistics shown are Pearson’s correlations. Regions on the extremes are labeled. (A) Gray matter volume results, (B) brain activation (amplitude of low-frequency fluctuation [ALFF]) results, and (C) NeuroQuery-based meta-analysis results.
Figure 2—figure supplement 3. Gray matter volume (normalized for head size) differences associated with sex in the UK Biobank dataset across the 45 anatomical regions.

Figure 2—figure supplement 3.

Samples were healthy controls (HCs) only and were matched for age, education, and hypertension. Values on the x-axis represent % difference in volume compared to the combined average (from both females and males). A negative % represents larger volume in females. Error bars are 95% CI. *p≤0.05; **p≤0.01; ***p≤0.001, Bonferroni corrected.
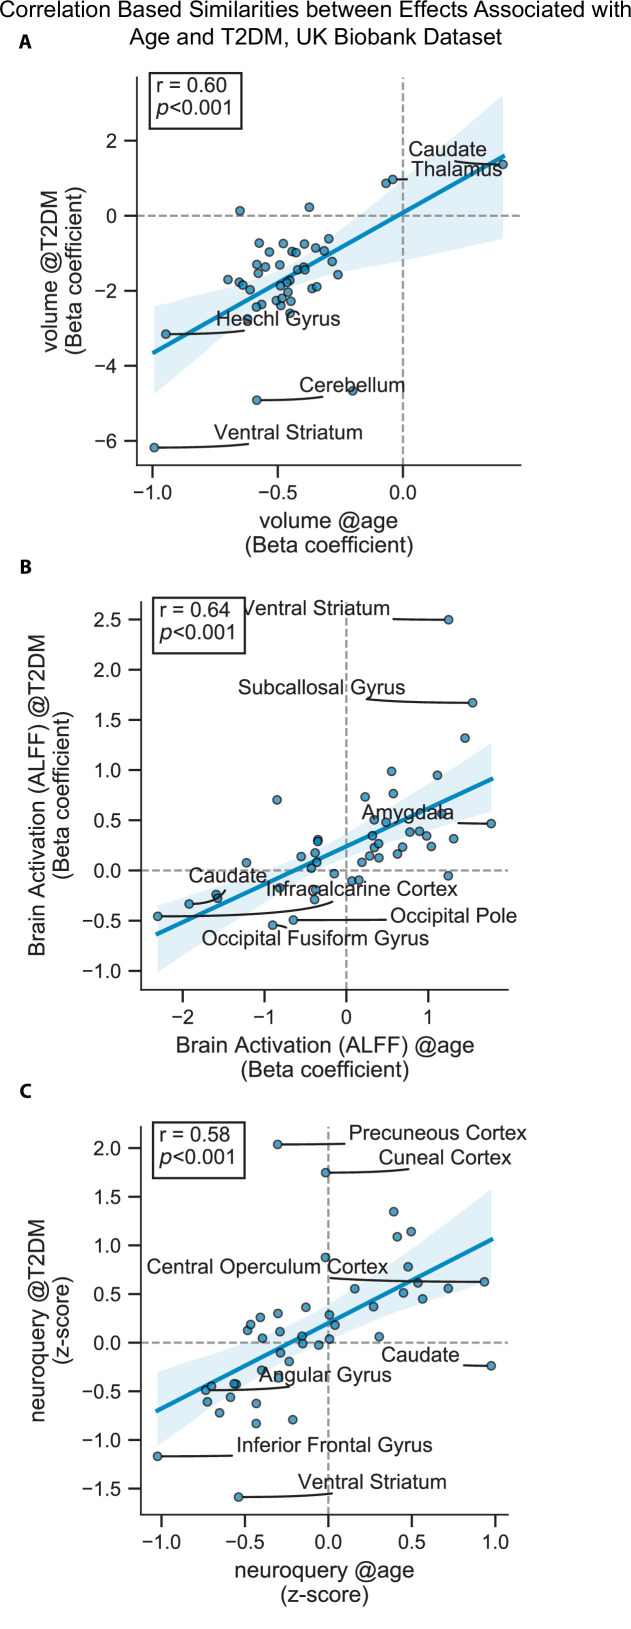
Figure 2—figure supplement 4. Plots representing trends in total gray matter volume (normalized for head size) across age, sex, and type 2 diabetes mellitus (T2DM).

Figure 2—figure supplement 4.

Samples were matched for age, education, and hypertension. The age-related decline appeared equivalent in the two sexes, but T2DM-associated deficits were stronger in males. With respect to disease duration (not shown), equivalent effects were observed magnitude-wise in males (24% ± 17%) and females (27% ± 32%), but these results were only significant in the male-only group (p=0.002), for which sample sizes were considerably larger (NM = 366, NF = 104).
Figure 2—figure supplement 5. Region-specific gray matter volume deficits associated with age (A) and type 2 diabetes mellitus (T2DM) (B) in the UK Biobank dataset, analyzed separately within females and males.

Figure 2—figure supplement 5.

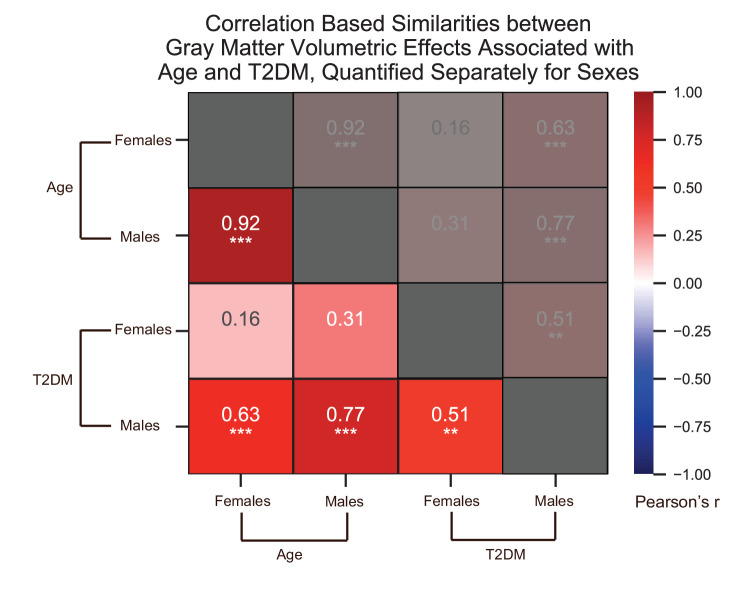
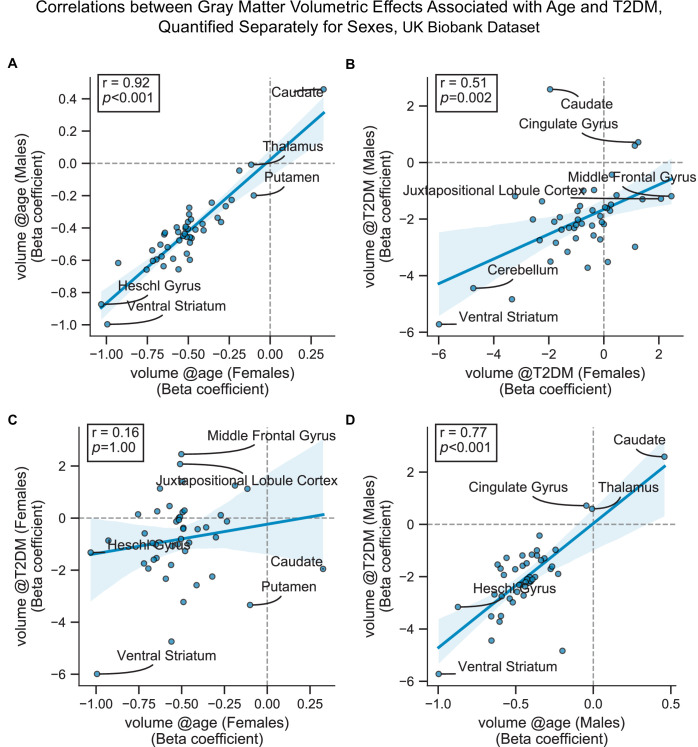
Samples were matched for age, education, and hypertension. The associated effects were correlated across males vs. females (see Figure 2—figure supplements 6 and 7A, B), With respect to T2DM, effects were generally stronger in males. Age and T2DM effects significantly correlated in males but not in females (see Figure 2—figure supplements 6 and 7C, D). Note that sample sizes were significantly larger for males compared to females. Error bars are 95% CI. *p≤0.05; **p≤0.01; ***p≤0.001, Bonferroni corrected.
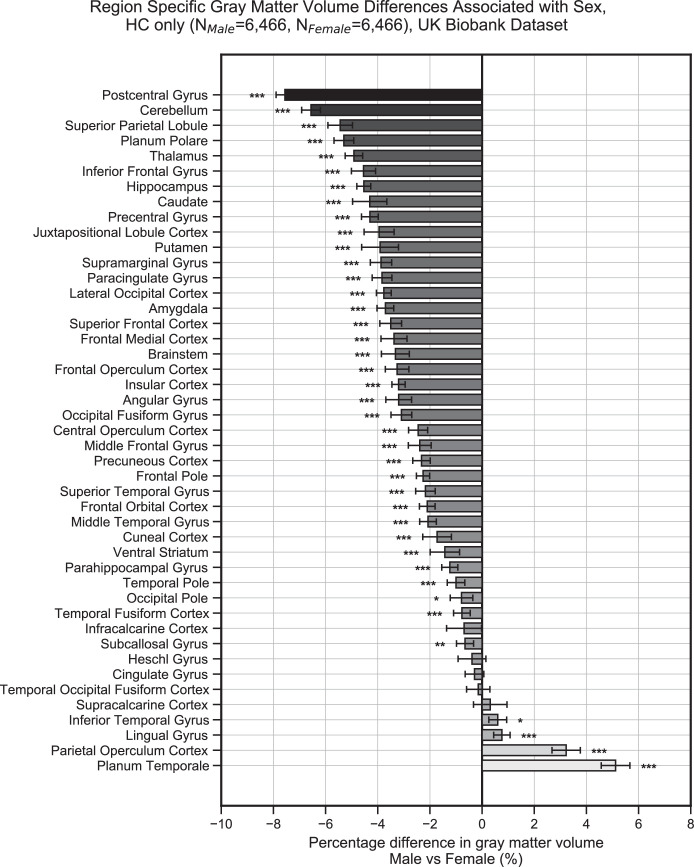
Figure 2—figure supplement 6. We quantified correlations (Pearson’s r) among the region-specific gray matter volume deficits associated with age and type 2 diabetes mellitus (T2DM), which we quantified in the UK Biobank dataset separately for females and males.

Figure 2—figure supplement 6.

See relevant scatterplots in Figure 2—figure supplement 7. *p≤0.05; **p≤0.01; ***p≤0.001, Bonferroni corrected.
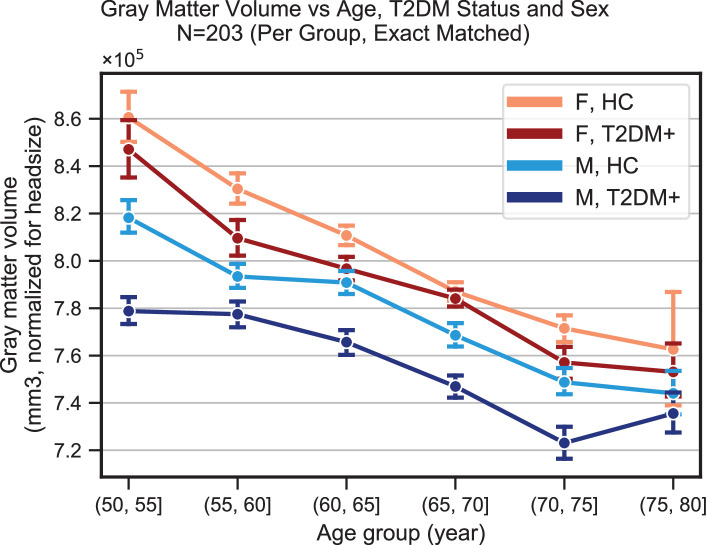
Figure 2—figure supplement 7. Scatterplots corresponding to the most relevant cells in Figure 2—figure supplement 6.

Figure 2—figure supplement 7.

Statistics shown are Pearson’s correlations. Regions on the extremes are labeled. All panels contain gray matter volume-related effects only. (A) Age-related effects in males vs. females, (B) type 2 diabetes mellitus (T2DM)-related effects in males vs. females, (C) age vs. T2DM effects in females only, and (D) age vs. T2DM effects in males only.
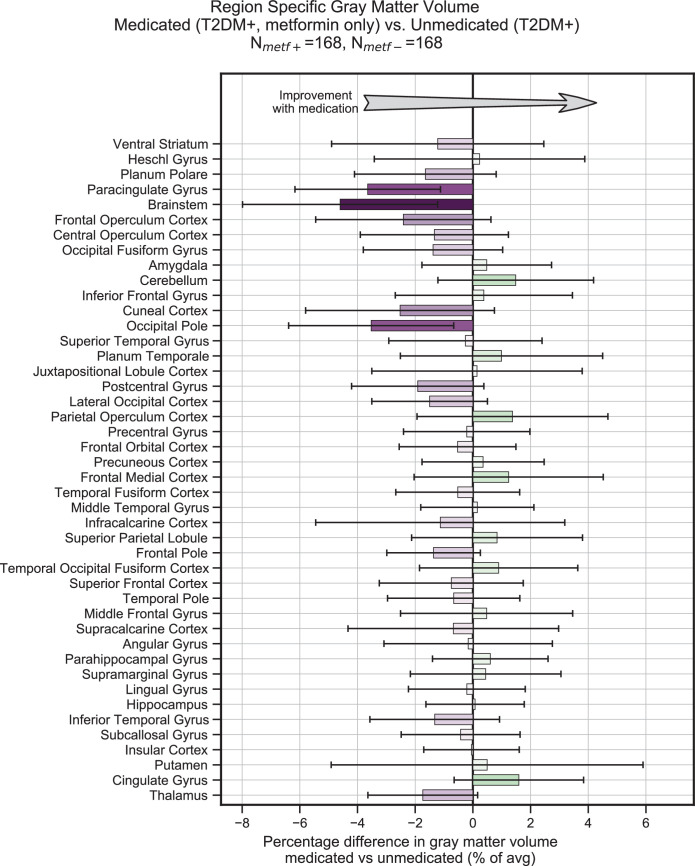
Figure 2—figure supplement 8. Treatment of type 2 diabetes mellitus (T2DM) patients with metformin had no impact on gray matter atrophy.

Figure 2—figure supplement 8.

We evaluated the UK Biobank dataset to determine whether treatment with metformin would prevent gray matter atrophy associated with T2DM. Among T2DM-diagnosed subjects only, we compared those subjects who reported using metformin but no other medications to those who reported not taking any medications to treat T2DM. We matched subjects for age, sex, education, and T2DM disease duration, and controlled for body mass index (BMI). Our analysis of gray matter atrophy did not detect significant (α = 0.05) improvement with metformin treatment (the direction of expected improvement by metformin is indicated by an arrow). Underlying sample size distributions can be found in Appendix 1—figure 7A. Error bars are 95% CI.