
Figure 3.
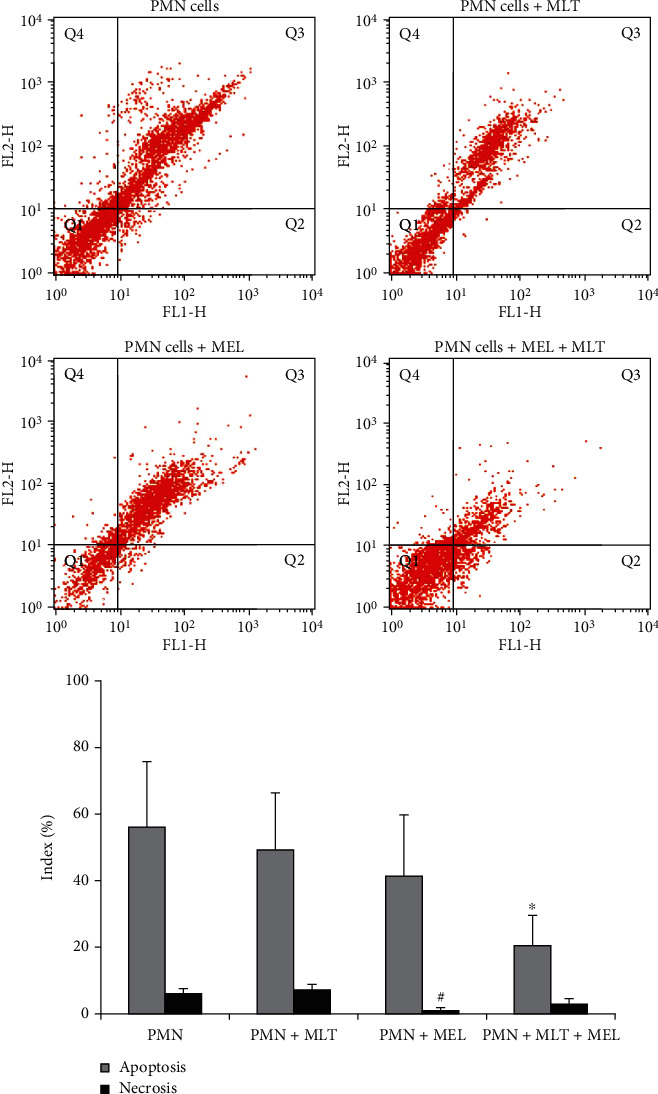
Apoptosis and necrosis in colostrum PMN cells. PMN: polymorphonuclear cells; MLT: melatonin; MEL: microemulsion after 72 hours of incubation. Cells were stained with Annexin V/PI and analyzed by flow cytometry. In the dot plot, the lower-left (Q1) quadrant corresponds to a viable cell; the lower-right (Q2) and upper-right (Q3) quadrants represent the percentage of apoptosis, and the upper-left (Q4) quadrant is the percentage of necrosis. p < 0.05. ∗Compared to apoptosis index of PMNs untreated with PMNs treated; #compared to necrosis index of PMNs treated with PMNs.