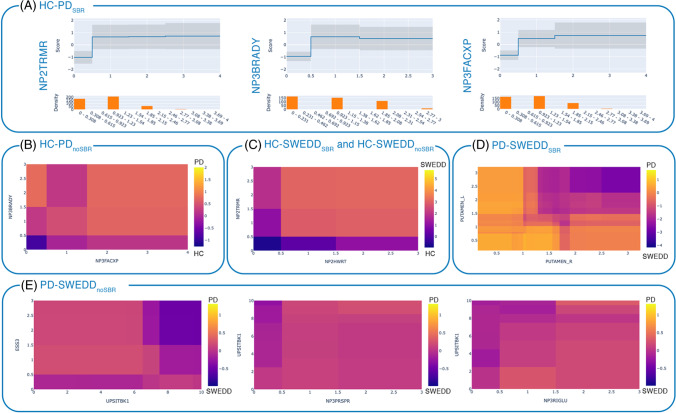
Fig. 2.
Global explanation of the EBM models: (A) Plots of feature interpretability (risk profiles) for the first three most important variables in the model HC-PDSBR, where the upper graph reports the feature risk score, and the bottom graph depicts the feature distribution. Heatmaps of the pairwise interactions (B) NP3FACXPxNP3BRADY in the EBM models HC-PDnoSBR where HC is negative class (purple) and PD is positive class (yellow); (C) NP2HWRTxNP2TRMR in the EBM models HC-SWEDDSBR and HC-SWEDDnoSBR, where HC is negative class (purple) and SWEDD is positive class (yellow); (D) PUTAMEN_RxPUTAMEN_L in the EBM model PD-SWEDDSBR, where PD is positive class (yellow) and SWEDD is negative class (purple); (E) UPSITBK1xESS3, NP3PRSPRxUPSITBK1, NP3RIGLUxUPSITBK1 in the EBM model PD-SWEDDnoSBR, where PD is positive class (yellow) and SWEDD is negative class (purple). The risk scores are logits (log odds). NP2TRMR = MDS-UPDRS-II Tremor (item 2.10); NP2HWRT = MDS-UPDRS-II Handwriting (item 2.7); ESS3 = Epworth Sleepiness Scale item 3 (Sitting, inactive in a public space); UPSITBK1 = UPSIT Booklet #1; NP3PRSPR = MDS-UPDRS-III pronation-supination movements right hand (item 3.6a); NP3RIGLU = MDS-UPDRS-III rigidity left upper limb (item 3.3c)

