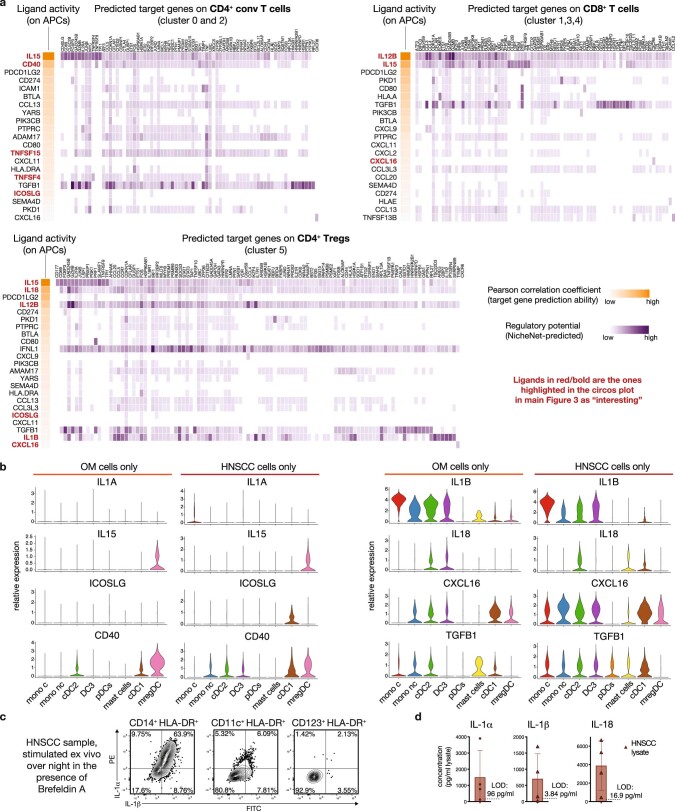
Extended Data Fig. 6. Additional plots related to the NicheNet predictions (related to main Figure 3).
(a) Plots derived from the NicheNet analysis showing the predicted ligand activity (orange) for the top ligands (as ranked by Pearson correlation coefficient), and the predicted target genes (purple) for all three separate NicheNet runs: sender APCs + receiver cells CD4+ conv T cell clusters (upper left plots), sender APCs + receiver CD8+ T cell clusters (upper right plots) and sender APCs + receiver CD4+ Treg cluster (lower plots). The full script utilized for the NicheNet analysis is available on Github (see material and methods). The ligands that are highlighted in main Figure 3b as “interesting” are highlighted in red/bold in this panel here. (b) The APC clusters from main Figure 2b were subsetted to contain only OM or HNSCC-derived cells, and Violin plots depict relative expression of the indicated ligand transcripts across all APC clusters either in OM-infiltrating cells (left columns) or HNSCC infiltrating cells (right columns). The ligands here match the ones highlighted as “interesting” in main Figure 3b. (c) Representative plots showing the protein expression for the cytokines IL-1α and IL-1β after ex vivo culture of bulk HNSCC-derived APCs in the presence of Brefeldin A, followed by intracellular cytokine staining. (d) Concentration of IL-1α and IL-1β and IL-18 as measured by Luminex analysis in flash-frozen HNSCC samples (n = 4). LOD: limit of detection.

