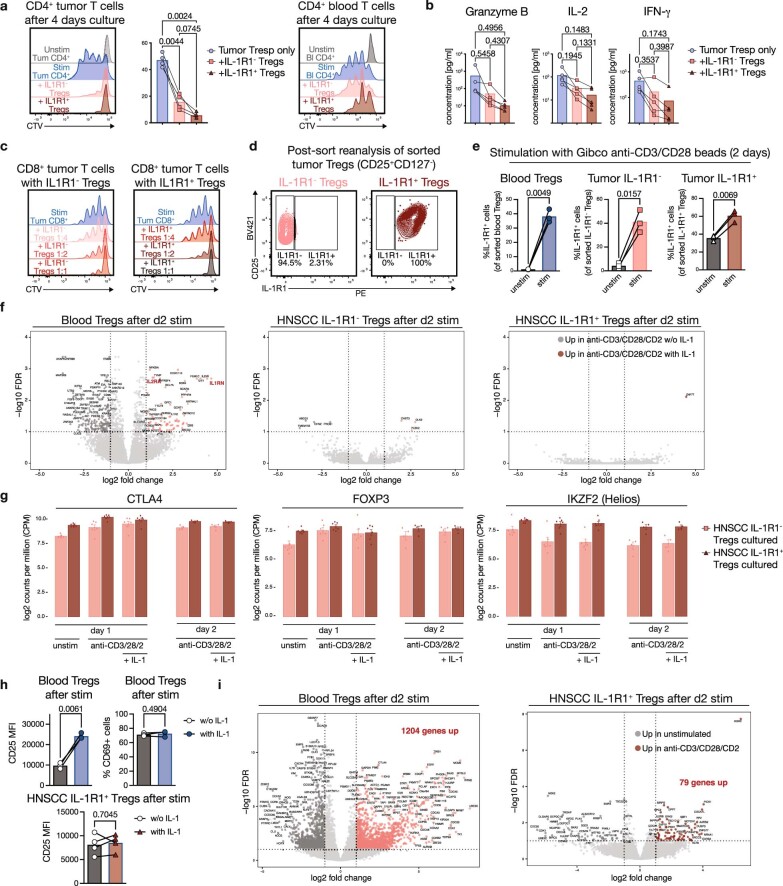
Extended Data Fig. 7. Additional data from Treg suppression and stimulation assays (related to main Figure 4).
(a) Proliferation of HNSCC-derived CD4+ T responder cells from tumor (left) or from blood (right) in an in vitro suppression assay with IL-1R1- Tregs (light red) and IL-1R1+ Tregs (dark red) from tumor. Representative histograms show dilution of Cell Trace Violet (CTV) after 4 days. n = 4. (b) Concentration of Granzyme B, IL-2 and IFN-g in the culture supernatants of the 4-day suppression assays shown in main Figure 4a. (c) Proliferation of HNSCC-derived CD8+ T responder cells in an in vitro suppression assay with titrated amounts of IL-1R1- Tregs (left plot) and IL-1R1+ Tregs (right plot). Histograms show CTV dilution after 4 days of culture with Treg-to-Teff ratios of 1:4, 1:2 and 1:1 (top to bottom). (d) Plots depict representative post-sort purity of HNSCC-Treg populations used for the stimulation experiments in main Figure 4b. (e) Expression of IL-1R1 after two days of in vitro culture either unstimulated or in the presence of Gibco anti-CD3/CD28 beads for Tregs sorted from peripheral blood (blue), IL-1R1- (light red) and IL-1R1+ Tregs (dark red) from HNSCC. n = 3. (f) Volcano plots showing differential gene expression of SMART-Seq bulk RNAseq data (250 sorted cells) of blood Tregs, HNSCC IL-1R1- and IL-1R1+ after 2 days of culture with anti-CD3/CD28/CD2 beads with (light and dark red) or without IL-1 (grey). (g) Transcripts per million for FOXP3, Helios (IKZF2) and CTLA4 from the bulk RNAseq data for the indicated time points and culture conditions. n = 4 for the d2 time point, n = 6 for the d1 time point. (h) CD25 median fluorescence intensity (MFI) on the indicated Treg populations after 2 days of culture with anti-CD3/CD28/CD2 beads +/− IL-1. n = 3 for blood and n = 4 for the HNSCC samples. (i) Volcano plots showing differential gene expression of SMART-Seq bulk RNAseq data (250 sorted cells) of blood Tregs and HNSCC IL-1R1+ Tregs after 2 days either unstimulated or with anti-CD3/CD28/CD2 beads. Number of DE genes upregulated is highlighted in bold.

