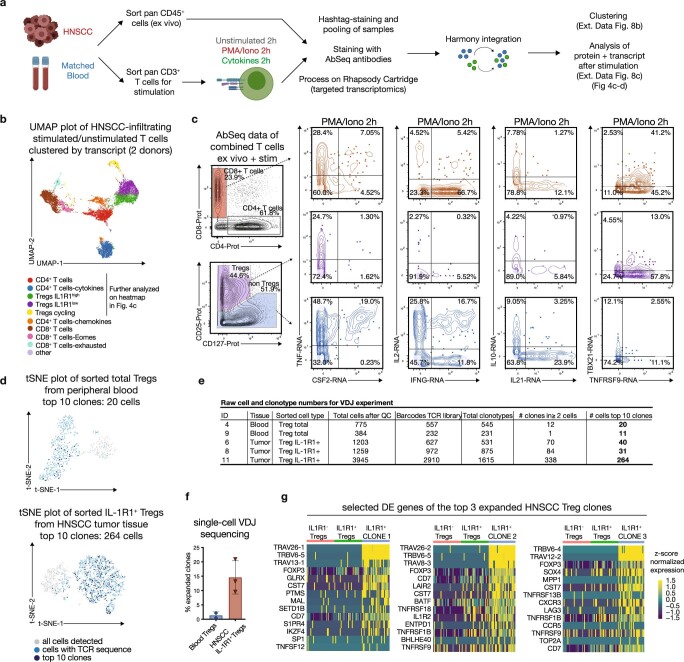
Extended Data Fig. 8. Additional analyses for the VDJ and targeted transcriptomics/Abseq data (related to main Figure 4).
(a) Experimental outline for the targeted transcriptomics+AbSeq experiments (see also material and methods). Combined data set after Harmony integration consists of ex vivo CD45+ cells, unstimulated T cells, and PMA-Ionomycin stimulated T cells from two different donors. (b) UMAP plot of tumor-infiltrating T cells of two different HNSCC donors after targeted transcriptomics and AbSeq as described in (a), colored by clustering based on transcript. The highlighted clusters are shown in more detail in main Figure 4c. (c) Selected cytokine transcripts are shown on manually gated T cell subsets from HNSCC AbSeq data (populations as identified by surface protein). Red plots show CD8+ T cells, violet plots show CD25+ CD127- Tregs, and blue plots show CD25- CD4+ non Tregs (all after PMA/Iono for 2h). TBX21 encodes for T-bet, TNFRSF9 encodes for CD137 (4-1BB). (d) t-SNE plot of sorted Tregs from the peripheral blood (top) and tumor (bottom) from a single donor after VDJ sequencing (10x genomics 5’ v1 chemistry). All cells with a complete TCR sequence are marked in light blue, and the top 10 clonotypes are marked in dark blue (encompassing 20 cells in the blood, and 239 cells in the tumor). (e) Table showing the total cell counts, barcode counts and detected clonotypes after VDJ sequencing for the indicated samples (n = 3 for the HNSCC tumor samples, n = 2 for matched peripheral blood). Counts are derived from VDJ Loupe browser. (f) Expanded clones by single-cell VDJ sequencing within sorted IL-1R1+ Tregs from HNSCC tumors relative to total Tregs from matched peripheral blood. Every TCR sequence that was present in 2 cells or more was considered an expanded clone. (n = 2 for blood, n = 3 for HNSCC) (g) Differentially expressed (DE) genes for the top 3 expanded clones from one single donor. Heatmaps show a selection of the top DE genes as identified by MAST for each clone (right side of each heatmap) vs downsampled HNSCC IL1R1- Tregs and IL1R1+ Tregs.

