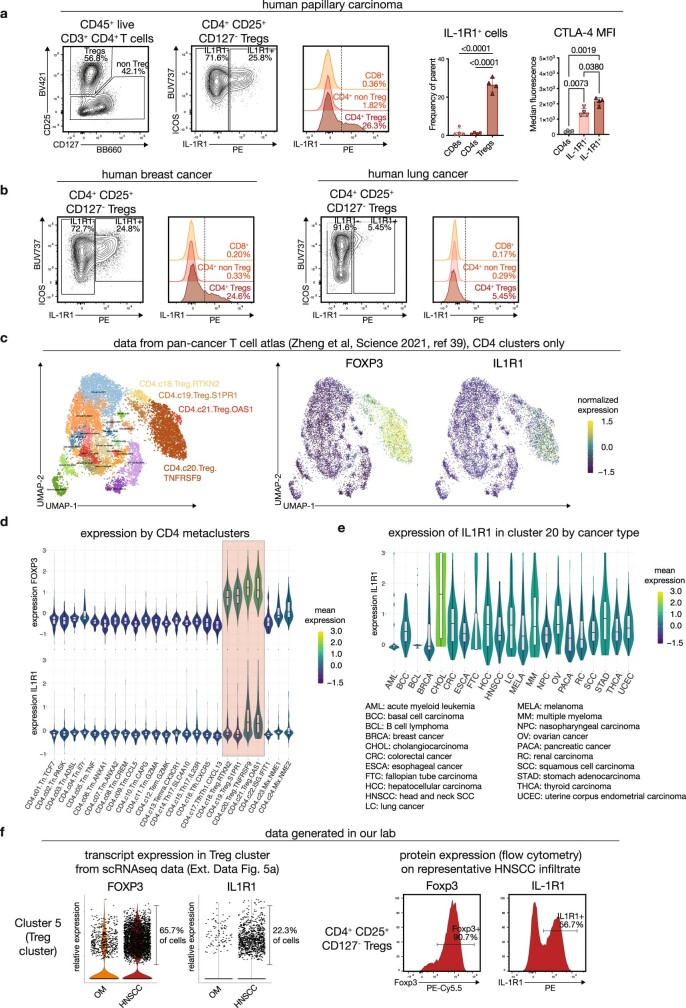
Extended Data Fig. 9. IL-1R1 expression in other cancer types (related to main Figure 4).
(a) IL-1R1 expression is present on CD4+ CD25+ CD127- Tregs in tumor tissues from a cohort of human papillary carcinoma patients. Plot on the very right shows quantification of the MFI for CTLA-4 on the indicated populations (n = 4 donors, one-way ANOVA with Tukey’s multiple comparisons). (b) To assess IL-1R1 protein expression in additional tumor types, we were able to collect a single sample of human breast cancer (left) and human lung cancer (right). IL-1R1 expression is present on breast cancer Tregs, but only at very low level/absent on lung cancer Tregs. (c) UMAP plot of all CD4 T cell metaclusters. There are four Treg clusters, which are highlighted on the right side of the UMAP plot. Heatmap overlays on the right side show expression of the transcripts encoding FOXP3 and IL1R1. (d) Violin plots depicting expression of FOXP3 (top panel) and IL1R1 (lower panel) across all CD4 T cell clusters of the combined data set as annotated by Zheng et al. Shaded area highlights the Treg clusters. IL1R1 expression is primarily found in cluster 20 and 21. (e) Violin plots depicting expression of IL1R1 in cells from cluster 20 CD4.c20.Treg.TNFRSF9) across different tumor types. While expression appears to be absent in AML and BCL, varying levels of IL1R1 transcript are present across all other tumor types. (f) IL1R1 transcript expression in scRNA-seq data may underestimate protein expression. Left panel shows violin plots for expression of the indicated transcripts in the Treg cluster 5 of our combined scRNAseq data from OM and HNSCC (see Extended Data Fig. 5a), right histograms show protein expression for the same genes by flow cytometry on live CD4+ CD25+ CD127- Tregs on a representative HNSCC sample. Data in panels c-e are publicly available from the pan-cancer T cell atlas (containing 21 cancer types), Zheng et al, Science 2021 (ref. 39). Figures were generated using the Shiny app on http://cancer-pku.cn:3838/PanC_T. Per the authors’ description, box plot overlays show 25th percentile (lower bound), median (center) and 75th percentile (upper bound), whiskers extend +/− 1.5*interquartile range. Data in panel a-b and f are from our own tissue collections.

