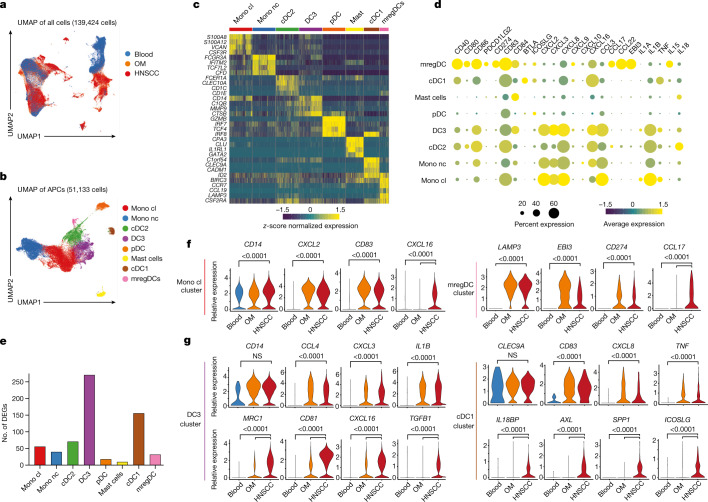
Fig. 2. Comprehensive scRNA-seq analysis of OM and HNSCC immune infiltrates.
a, UMAP of the combined scRNA-seq data after quality filtering and Harmony integration, coloured by tissue origin (more details in Extended Data Fig. 3). b, UMAP plot of the APC populations after subsetting and reclustering, coloured by cluster. Mono cl, classical monocyte; Mono nc, non-classical monocyte. c, Key DEGs in each APC cluster. d, Scaled dot plot showing the transcript expression across APC clusters from combined OM and HNSCC data (excluding blood). e, Number of DEGs between HNSCC and OM-derived cells per APC cluster as determined by MAST. f, Violin plots showing the expression of selected transcripts for the monocyte cluster (left) and the mregDC cluster (right). g, Violin plots showing the expression of selected transcripts for the DC3 cluster (left) and the cDC1 cluster (right). All graphs are showing combined data for n = 4 for OM samples and n = 4 for HNSCC samples, with a total of 139,424 cells after filtering for quality control criteria. Violin plots show adjusted P-values (Bonferroni correction) as calculated by the Seurat implementation of MAST.

