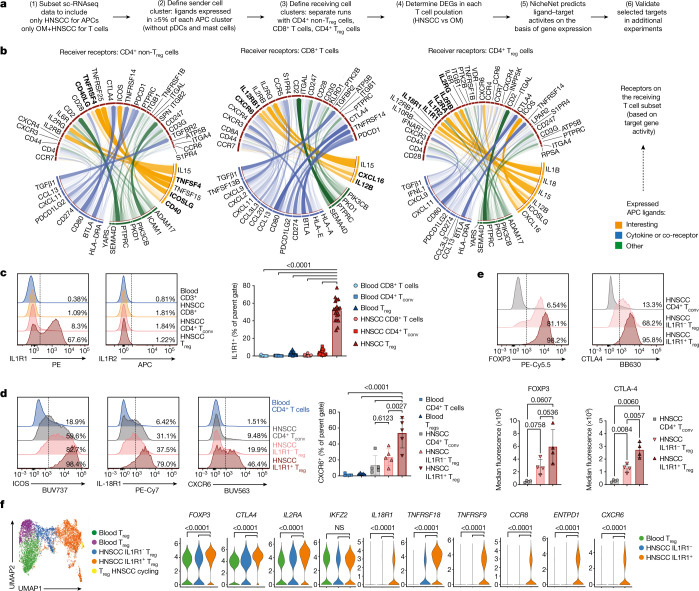
Fig. 3. NicheNet analysis predicts tumour-enriched APC-T cell crosstalk.
a, The NicheNet workflow was applied to the scRNA-seq data shown in Fig. 2. b, Circos plots showing the top ligand–receptor pairs identified by NicheNet. Transparency of the connection represents the interaction strength. APC ligands are on the bottom, TCRs are on top. c, Representative plots and quantification for the surface protein expression of IL1R1 (n = 19). d, Representative plots showing the expression of ICOS, IL-18R1 and the chemokine receptor CXCR6 on the indicated T cell subsets. Right, quantification for CXCR6 (n = 5). e, Representative plots (top) and mean fluorescence intensity (bottom) for FOXP3 and CTLA4 on T cell subsets from HNSCC (n = 4). f, UMAP plot of Treg cells sorted from blood and tumour of n = 3 donors with HNSCC after targeted transcriptomics, coloured by cluster. Violin plots show the expression of selected transcripts across Treg clusters. All summary graphs are represented as mean ± s.d. Statistical analyses of cytometry data was performed using one-way ANOVA with Tukey’s multiple comparisons test, analysis of targeted transcriptomics used the Seurat implementation of MAST (adjusted P-values after Bonferroni correction).

