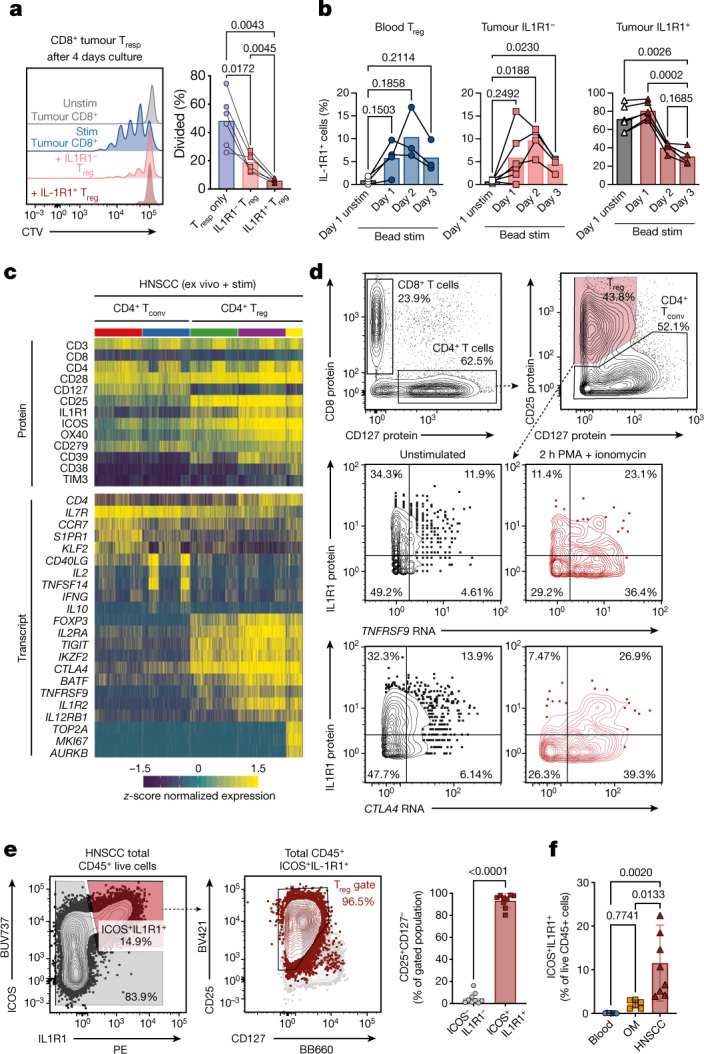
Fig. 4. IL1R1-expressing Treg cells represent a functionally distinct population.

a, Proliferation of HNSCC-derived CD8+ T responder (Tresp) cells (n = 6) in an in vitro suppression assay with IL1R1− Treg cells (light red) and IL1R1+ Treg cells (dark red). Representative histograms show dilution of Cell Trace Violet. Stim, stimulated; unstim, unstimulated. b, Expression kinetics of IL1R1 after in vitro culture in the presence of anti-CD3/CD28/CD2 beads for Treg cells sorted from peripheral blood (left, n = 3), IL1R1− Treg cells (middle, n = 4) and IL1R1+ Treg cells (right, n = 5) from HNSCC. c, Tumour-infiltrating T cells from two donors with HNSCC after performing short-term stimulation and targeted transcriptomics with AbSeq (Extended Data Fig. 8). Heat maps show top differentially expressed proteins (top) and transcripts (bottom) across the selected clusters. d, TNFRSF9 and CTLA4 transcript expression by Treg cells left unstimulated (left) and after short-term stimulation with PMA and ionomcyin (right). The y-axis shows IL1R1 protein expression. e, Representative plots and quantification (n = 9) showing that within total CD45+ cells in HNSCC nearly all ICOS+ IL1R1+ cells are Treg cells. f, Quantification of total ICOS+ IL1R1+ cells in peripheral blood (n = 7), OM (n = 6) and HNSCC samples (n = 8). All summary graphs are represented as mean ± s.d. Statistical analyses were performed using one-way ANOVA with Tukey’s multiple comparisons test or using a two-tailed paired t-test (e).
