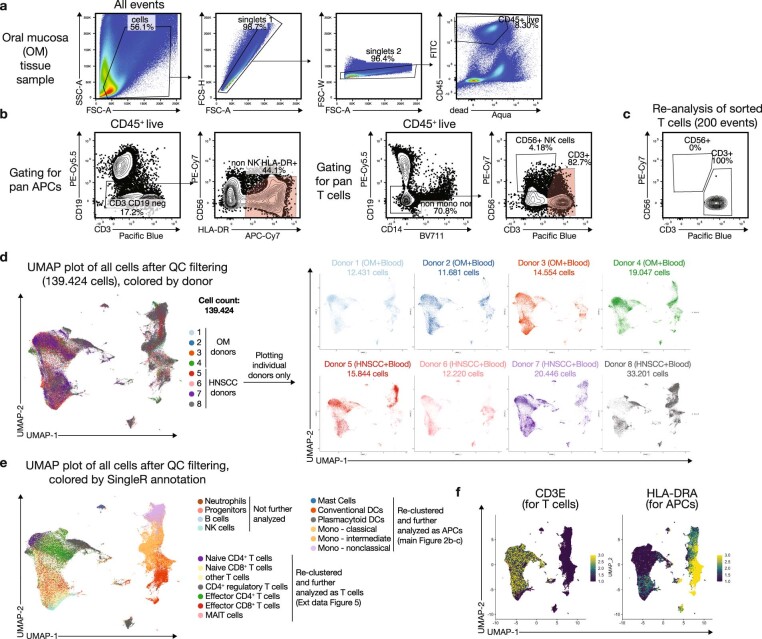
Extended Data Fig. 3. Gating strategy for the sorts and additional plots for the scRNA-seq data (related to main Figure 2).
(a) General gating of a representative OM tissue samples for CD45+ live singlets for the WTA 10x scRNA-seq experiments. (b) Gating strategy used for sorting the pan APC population and for pan T cells for WTA 10x scRNA-seq experiments. Red shaded gates were sorted. For some experiments (data not shown) MR1-Tetramer+ MAIT cells and CD56+ NK cells were sorted separately. (c) Representative re-analysis of a fraction of sorted pan T cells before loading onto the 10x Chromium controller. (d) UMAP plots of the combined scRNA-seq data after QC filtering (see Github script) and Harmony integration, colored by donor. A total of 139.424 cells is shown. Right plots depict individual donors separately, showing that cells from each donor distribute across the entire plot. Of note, for some donors only the T cell or the APC population could be sorted. (e) UMAP plots of the combined scRNA-seq data after QC filtering and Harmony integration, colored by simplified cell type calling derived from SingleR. The populations indicated in the legend were used for re-clustering and more in-depth analysis of the APC population (main Figure 2b) and T cells (Extended Data Fig. 5), respectively. (f) UMAP plots show heatmap overlays for CD3E and HLA-DRA transcripts to highlight the main lineages.

