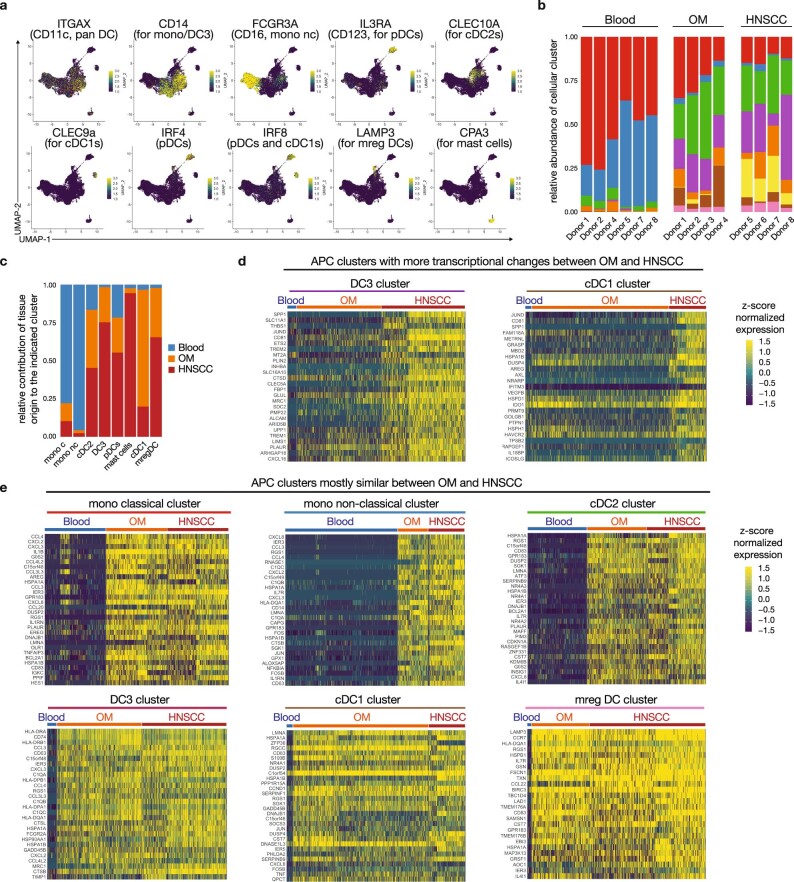
Extended Data Fig. 4. Additional analyses of the scRNA-seq data for the APC populations (related to main Figure 2).
(a) Heatmap overlays for the expression of key lineage transcripts on the UMAP plot for the APC population (see main Figure 2b). (b) Relative abundance of the APC clusters across donors and tissue origin. (c) Relative contribution of each tissue source to the indicated APC cluster (colors match the cluster description in main Fig. 2b). (d) Heatmaps showing the top 30 transcripts that were differentially expressed in HNSCC for the DC3 cluster (left) and cDC1 cluster (right), which are the two clusters showing the largest number of DE genes between OM and HNSCC (see main Figure 2e). (e) Heatmaps showing the top 30 transcripts that were shared between OM and HNSCC, but differentially expressed from matched peripheral blood, for each of the indicated APC clusters (mono classical, mono non-classical, cDC2s, DC3s, cDC1s and mreg DCs). For (d) and (e), the APC clusters identified in the scRNA-seq data (main Figure 2b) were subsetted, and either the genes shared between OM and HNSCC cells, or genes differentially expressed between HNSCC and OM cells were identified by the Seurat implementation of MAST (see material and methods and Github script for additional details).

