Fig. 1.
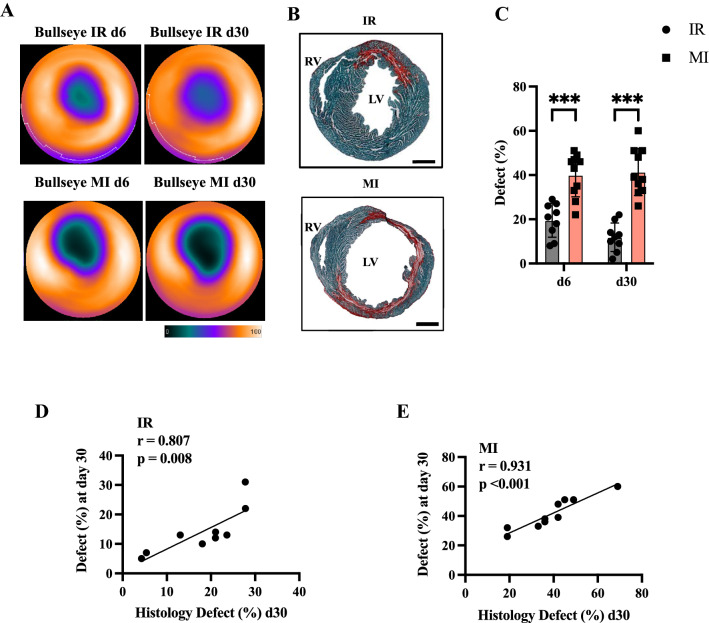
Assessment of myocardial defect in 18F-FDG PET imaging after transient and permanent LAD ligation. A Representative polar bulls-eye image of the left ventricle in IR day 6 and day 30 (upper images) and MI day 6 and day 30 (lower images) showing the defect by diminished 18F-FDG uptake. Colour Scale from QPS (Cool and in percentage range). B Representative histology section of hearts 30 days after IR (upper panel) and MI (lower panel) LAD ligation. Right ventricle (RV), left ventricle (LV). Sirius Red fast green staining of the left ventricle indicates the defect area. Bar equals 100 µm. C Quantification of the left ventricular defect after IR injury (in grey) and MI (in rose). D and E Correlation of histological defect to PET defect at day 30 after IR and MI injury. All groups: n = 9–10. All data represent mean ± SD. *p = 0.05, **p < 0.01, ***p < 0.001

