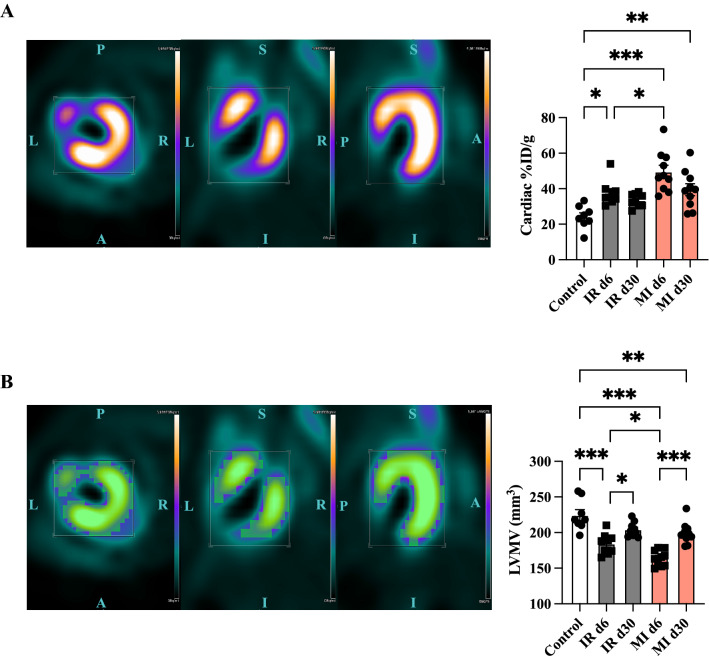
Fig. 2.
Alterations in LVMV and cardiac %ID/g after transient and permanent LAD ligation. A Representative static image after permanent LAD ligation exported from Siemens Inveon Workplace in different axes (left (L), right (R), planar (P), anterior (A), inferior (I), and sagittal (S). Bar equals uptake in from 0 to 5.9 × 10⁶ Bq/ml. Quantification of the cardiac %ID/g in the different groups on the right side. Control (in white), MI (in rose), and IR (in grey). All groups: n = 8–10. All data represent mean ± SD. *p = 0.05, **p < 0.01, ***p < 0.001. B Illustration of the LVMV (in green) after permanent LAD ligation. Quantification of the LVMV after transient and permanent LAD ligation is shown on the right side. All groups: n = 8–10. All data represent mean ± SD. *p = 0.05, **p < 0.01, ***p < 0.001

