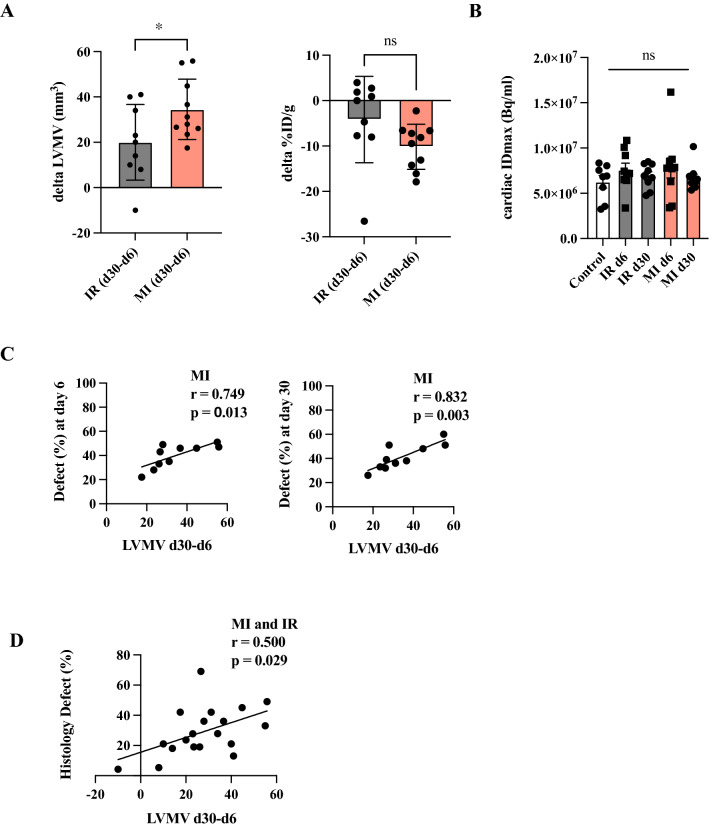
Fig. 3.
Increasing LVMV from day 6 to day 30 and correlation to defect area. A Difference in LVMV and %ID/g from day 30 to day 6 among the two cardiac injury models. B Quantification of the maximum ID/g among the different experimental groups. C Correlation of LVMV d30-d6 to defect area at day 6 (on the left side) and to day 30 (on the right side). All groups: n = 8–10. All data represent mean ± SD. *p = 0.05, **p < 0.01, ***p < 0.001. D Correlation of LVMV d30-d6 to histological defect area after MI and IR injury

