Fig. 4.
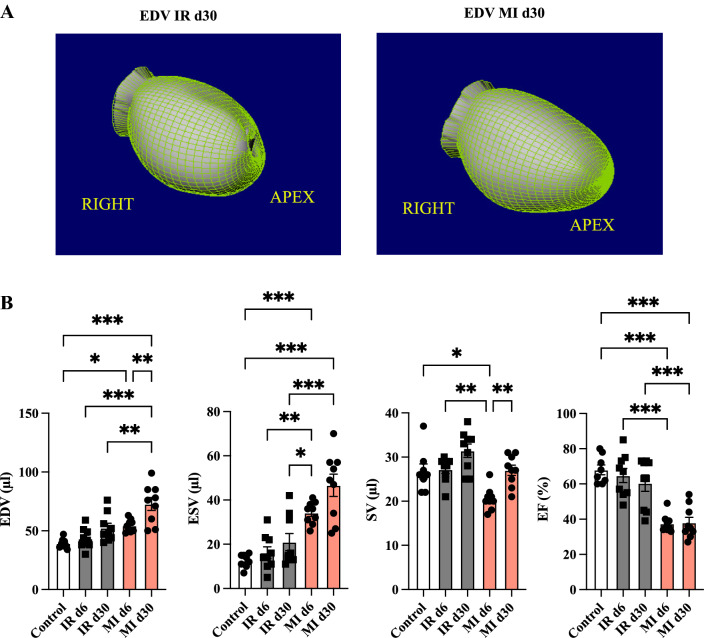
Longitudinal functional left ventricular parameters. A Illustrates three-dimensional evaluation from QGS software of the left ventricular EDV in the RAO view. Left picture: EDV at IR day 30 and right picture: EDV at MI day 30 illustrating the LV dilation. B Comparison of cardiac volume and function parameters at day 6 and d 30. Control (in white), IR (in grey) and MI (in rose). All groups: n = 8–10. All data represent mean ± SD. *p = 0.05, **p < 0.01, ***p < 0.001

