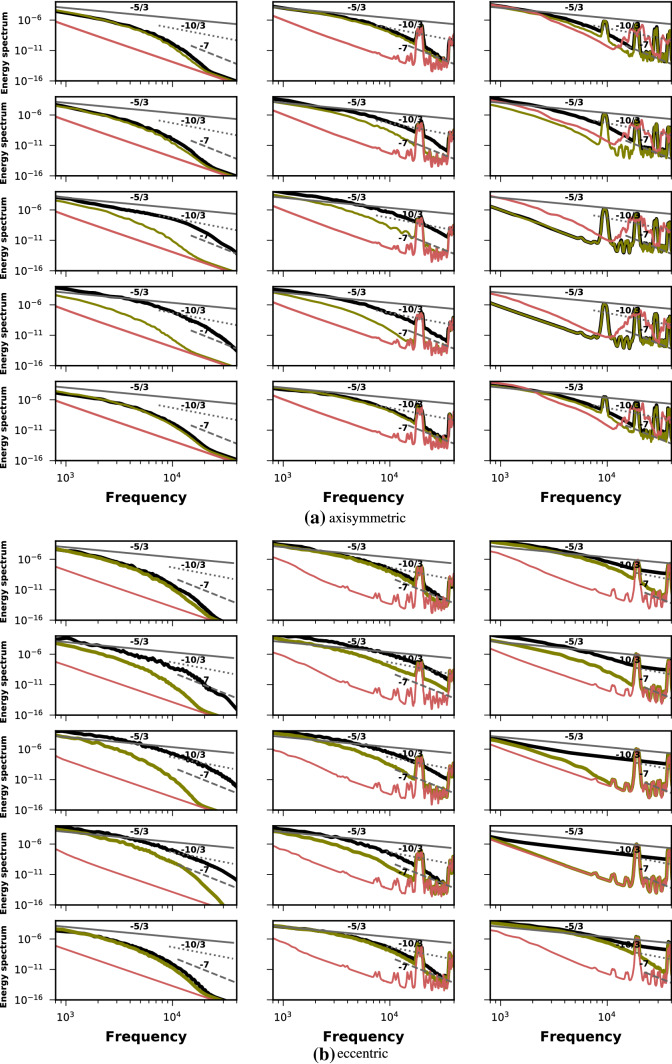
Fig. 5.
Power spectral density of the turbulent kinetic energy in axisymmetric and eccentric cases at . The black, green and red lines respectively correspond to , and stenosis degrees. Each column shows the PSD at and 4 diameters downstream of stenosis respectively during the blowing stage. Each rows from left to right shows PSD for oscillation frequencies of , and respectively. The solid, dotted and dashed lines have slope of , and

