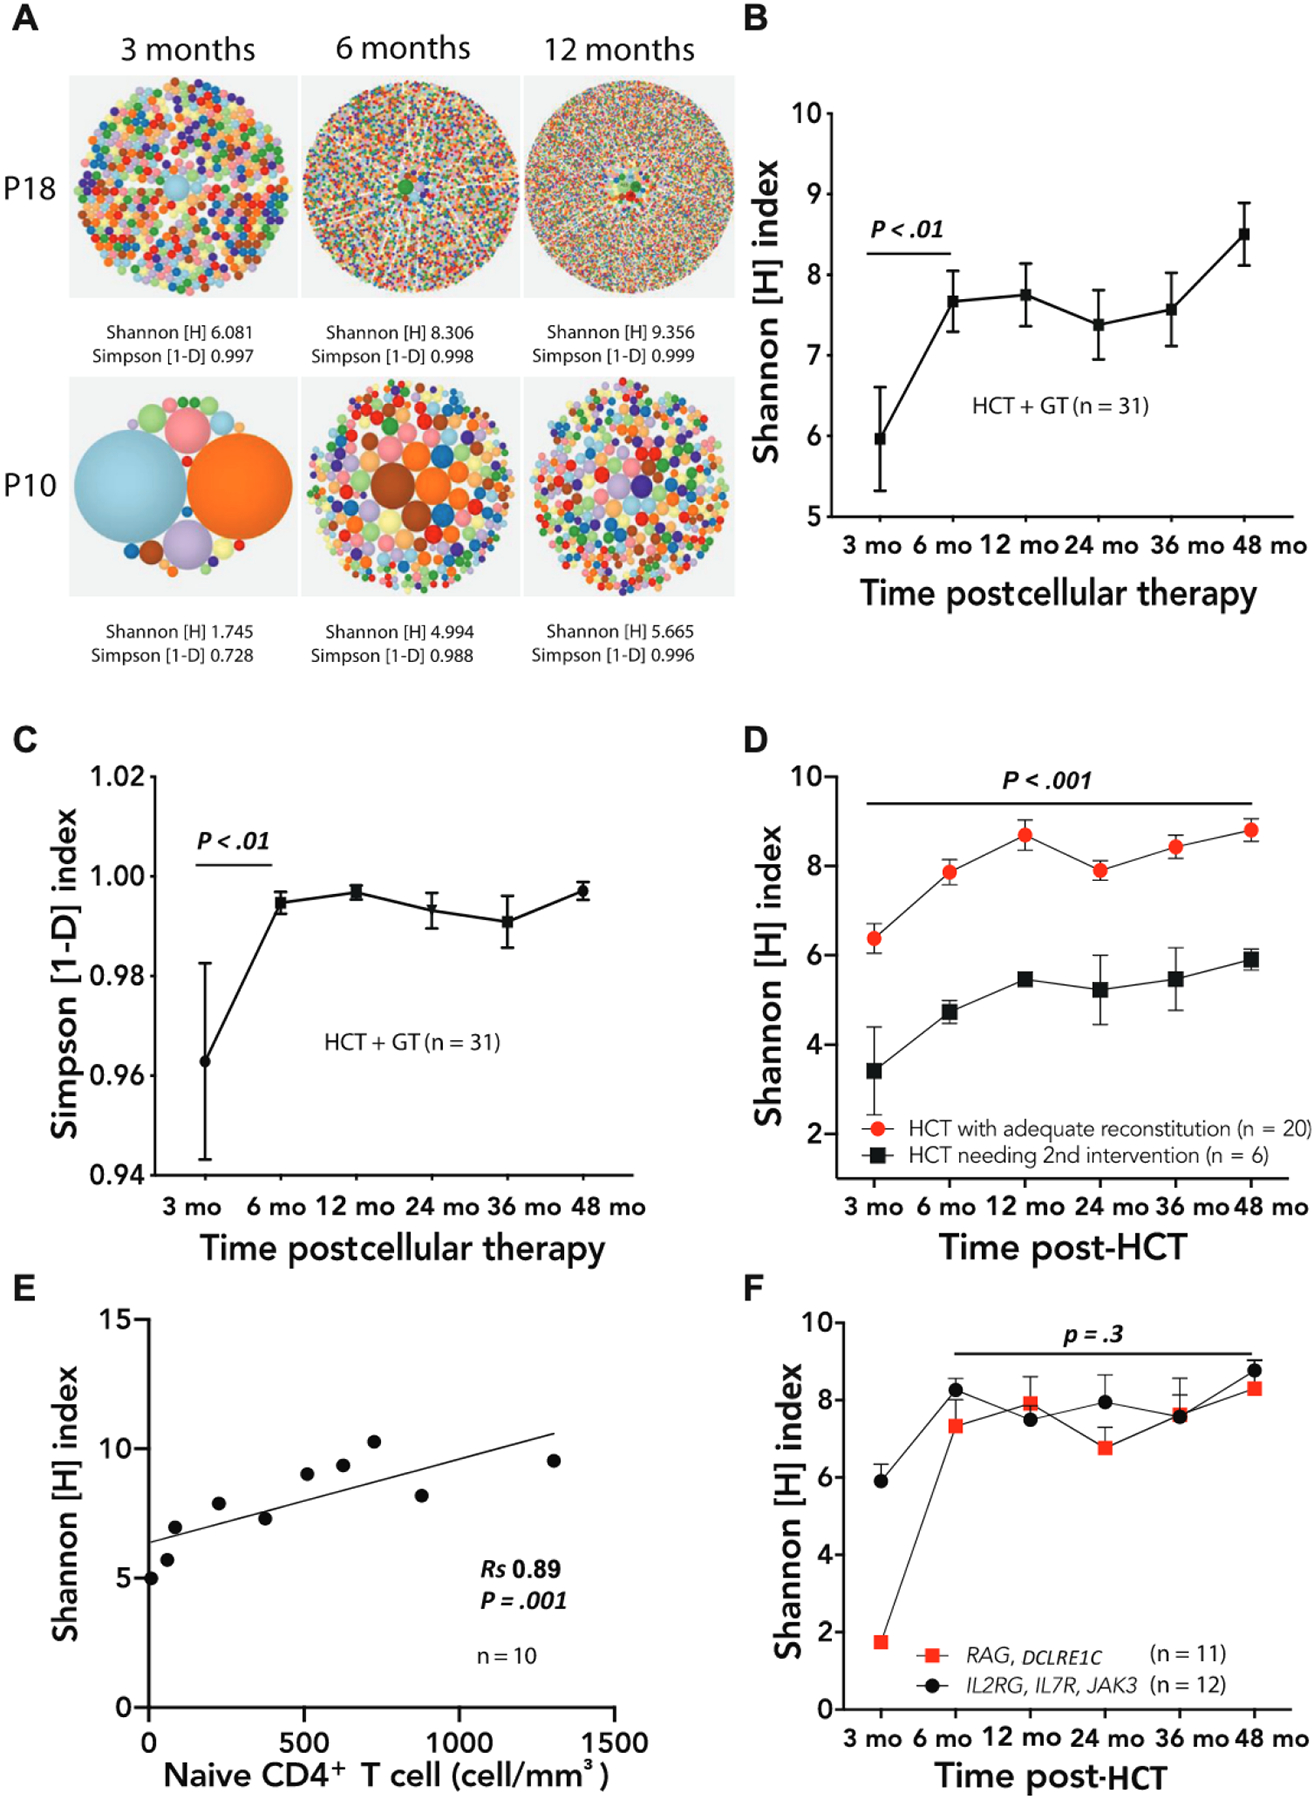
FIG 1.

A, Representative hierarchical tree maps showing increasing TRB repertoire diversity following successful HCT in patient 18 (P18, top row) and failed HCT in patient 10, treatment A (P10, bottom row). (B) Increasing Shannon [H] index of TRB diversity and (C) Simpson [1-D] index of clonality in all patient cellular treatments over time. The P values refer to differences between 3 and 6 months post-HCT. D, Persistently lower Shannon diversity scores following cellular treatments that ultimately needed another treatment (black squares) compared with those that were successful (red circles); differences were apparent as soon as 3 months after cellular treatments. The P value refers to the differences between the 2 groups considering all time points. E, Correlation (Spearman rank coefficient Rs) between naive CD4+ T-cell number and Shannon [H] index of diversity 6 months after a cellular treatment. F, Relationship between TCR diversity and genotype groupings (IL2RG, IL7R, and JAK3, black circles; RAG and DCLRE1C, red squares). The number of samples available at the 3-month time point was insufficient to assess whether the difference between the 2 groups was significant (only 1 sample was available for the RAG/DCLRE1C group at 3 months). In Fig 1, B-D and F, symbols and bars correspond to mean ± SEM.
