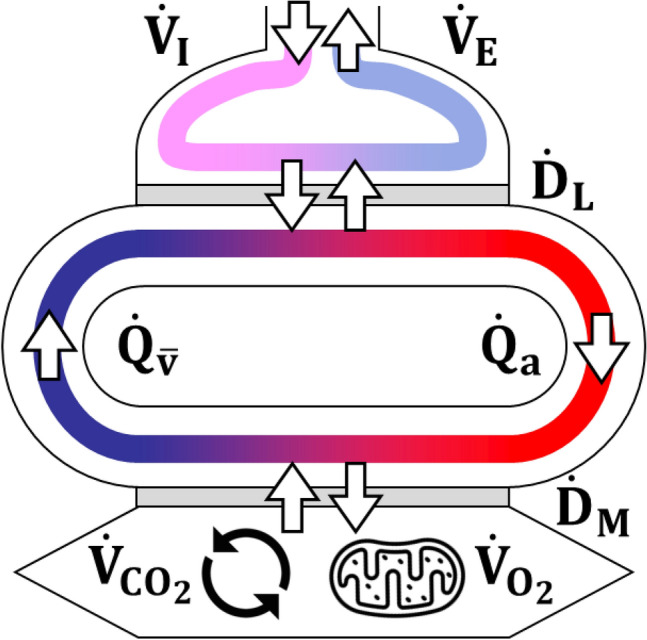
Fig. 17.

Schematic representation, in the form of a visual abstract, of the flow of oxygen and carbon dioxide along the respiratory system, from ambient air up to the actual site of chemical production (Krebs cycle) or consumption (mitochondria). Each white arrow represents a potential source of deviation from the steady state of the integrated flows. The oxygen or the carbon dioxide flows at a certain level along the system correspond to the difference between two opposite white arrows. inspired gas flow, expired gas flow, lung diffusive flow of a gas, arterial flow of a gas, venous flow of a gas, muscular diffusive flow of a gas, oxygen consumption, carbon dioxide production
