
Fig. 4.
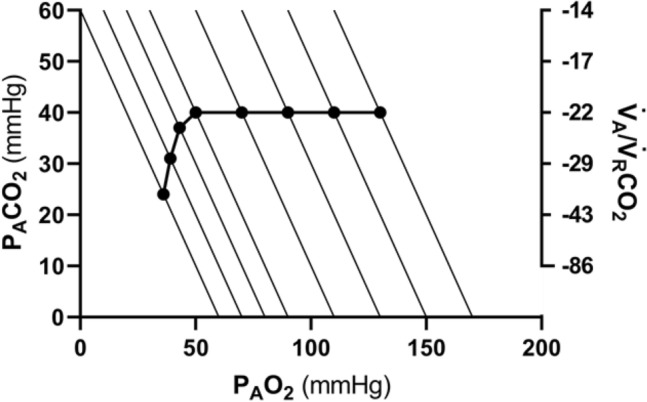
On the O2–CO2 diagram for alveolar air, the thin parallel lines are isopleths for a lung respiratory quotient of − 1.0, which intercept the x-axis at different inspired air points. As the inspired partial pressure of oxygen () decreases, the isopleth is displaced to the left. The black dots correspond to the incurring alveolar gas composition at each . The line connecting all these points (thick black curve) is the alveolar air curve. and are the alveolar partial pressures of carbon dioxide and oxygen, respectively. alveolar ventilation to lung carbon dioxide flow ratio
[Modified after Ferretti (2015)]