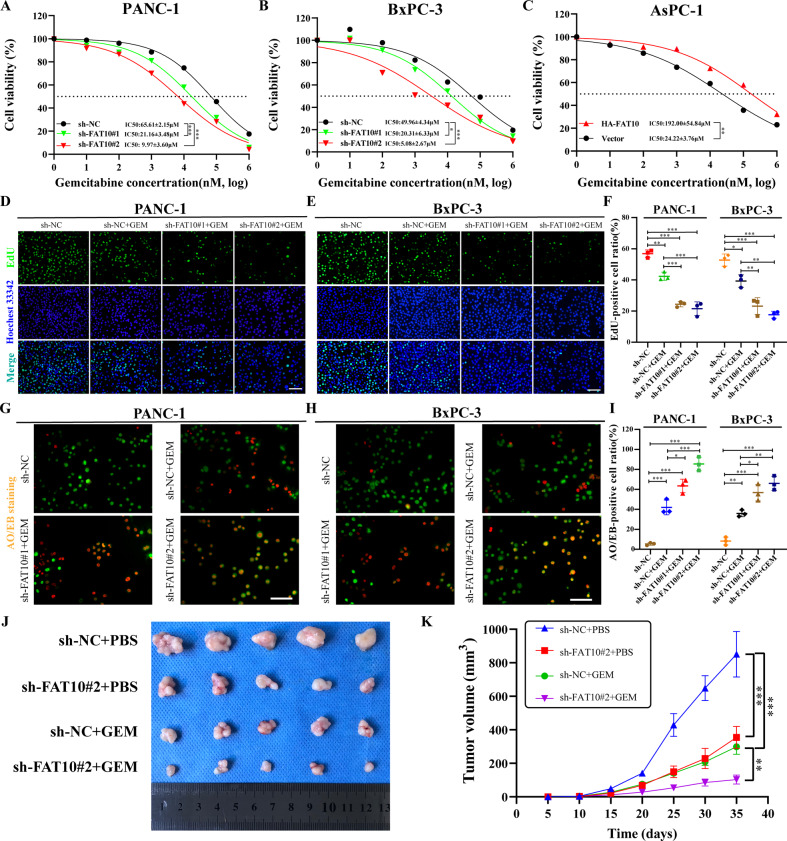
Fig. 3. Inhibition of FAT10 increases the chemotherapeutic sensitivity of PC to GEM.
A–C The IC50 of PC cells (FAT10 knockdown or overexpression) exposed to different concentrations of GEM was determined by cell viability experiments. D–F The effect of knocking down FAT10 on the proliferation rate of PC cells treated with GEM was detected by EdU staining. G–I The apoptosis rate of PC cells with FAT10 knockdown was detected by AO/EB staining after GEM treatment. Data represent the mean ± SD of triplicate experiments and were statistically analyzed by one-way ANOVA. J Representative images of different groups of tumors removed from mice are shown. K Growth curve showing changes in tumor volume in mice from different groups. Growth was assessed every 5 days beginning from the day of injection and during GEM treatment. At the end of the experiment, the tumor was dissected and photographed, and the tumor volume (V) was calculated as follows: V = 0.52 × length × width2 and analyzed by one-way ANOVA. *p < 0.05, **p < 0.01, ***p < 0.001.

