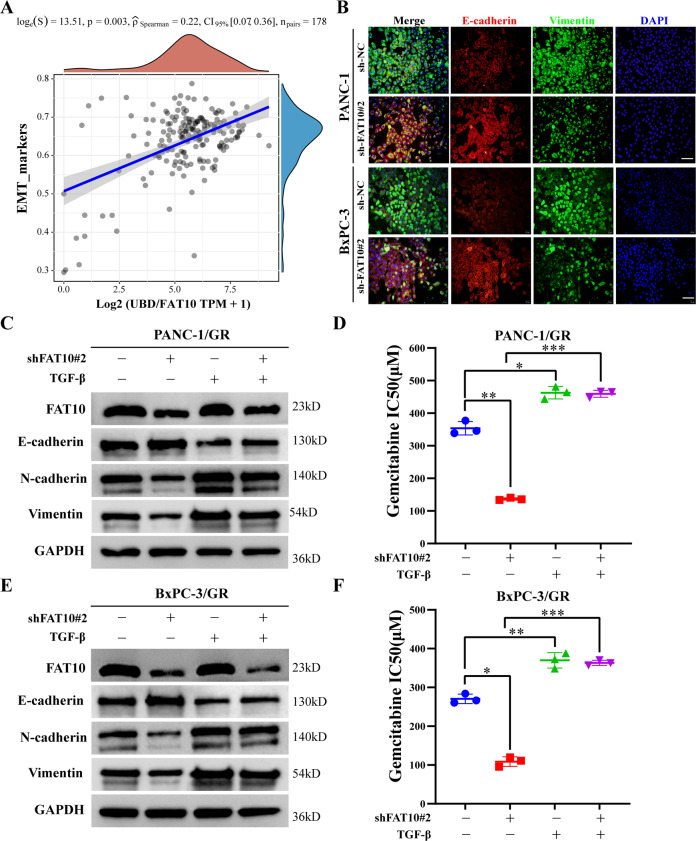
Fig. 4. FAT10 regulates EMT to promote chemotherapeutic resistance in PC cells.
A Spearman correlation analysis of the correlation between FAT10 (UBD) and EMT pathway score. FAT10 expression is represented by the abscissa, and the EMT pathway score is represented by the ordinate. A density curve to the right represents the trend in the distribution of pathway scores, a density curve to the upper part represents the trend in the distribution of gene expression. The top part shows the p-value, correlation coefficient, and correlation calculation method. B Immunofluorescence analysis of the effect of inhibiting FAT10 on the expression of EMT-related proteins (E-cadherin and Vimentin) in PC cells. Scale bar, 50 μm. C–F GEM-resistant PC cell lines (PANC-1/GR and BxPC-3/GR) were transfected with interfering plasmid sh-FAT10#2 and or EMT activator (TGF-β, 10 ng/mL) for 48 h. C, E Western blot analysis was used to observe the expression of EMT-related proteins in each treatment group. D, F Cell viability experiments were used to calculate the half-inhibitory concentration (IC50) of GEM-treated PC-resistant cells in each treatment group. Data represent the mean ± SD of triplicate experiments and were statistically analyzed by one-way ANOVA. *p < 0.05, **p < 0.01, ***p < 0.001.

