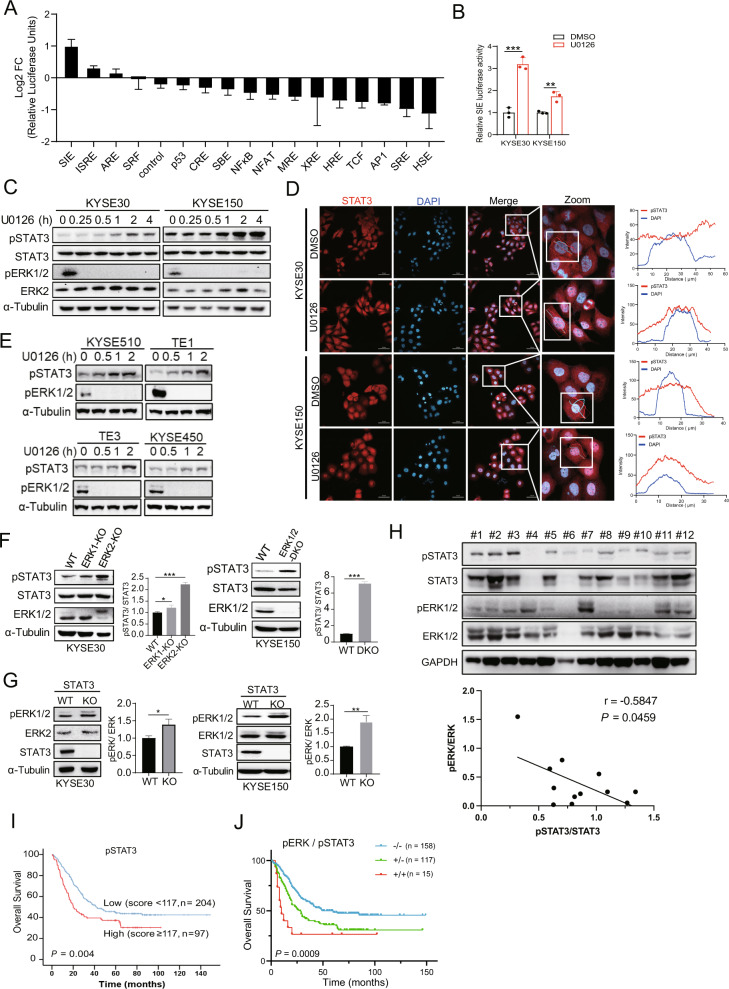
Fig. 2. Inverse correlation of pERK and pSTAT3 expression in ESCC.
A KYSE150 cells were transfected with luciferase reporter genes of 16 tumor-associated signaling pathways and renilla luciferase for 24 h. Cells were incubated with DMSO or U0126 (5 μM) for 6 h and luciferase activity was measured using Dual-Luciferase Assay. Log2 FC was assessed by dividing the luciferase signal obtained from U0126 treated cells by that obtained from DMSO-treated ones. Error bars represent the mean ± SD. B KYSE30 and KYSE150 were transfected with SIE and renilla luciferase reporter for 24 h. Cells were incubated with DMSO or U0126 (5 μM) for 6 h and luciferase activity was measured. C Western blotting showed the expression of activated and total signal transducer and activator of transcription 3 (STAT3) and ERK expression in KYSE30 and KYSE150 treated with U0126 in a time-dependent manner. D STAT3 and DAPI staining in KYSE30 and KYSE150 after U0126 (5 μM) treatment for 2 h. The fluorescence signal intensity of STAT3 and DAPI was analyzed using the ZEN2.3 software. Scale bar, 50 μm. E Western blotting showed the expression of pSTAT3 and pERK in KYSE450, KYSE510, TE1 and TE3 treated with U0126 in a time-dependent manner. F Western blotting shows the expression of pSTAT3 in wild-type (WT), ERK1-KO, ERK2-KO, and ERK1/2-DKO ESCC cells. G Western blotting shows the expression of pERK in WT and STAT3-knockout (KO) cells. Densitometry analyses of pSTAT3 or pERK expression were performed. Error bars represent the mean ± SD. *P < 0.05, **P < 0.01, ***P < 0.001. H Western blotting showed the phosphorylated and total STAT3 and ERK expression in 12 human ESCC tissue. Densitometry analyses and Pearson correlation showed a negative correlation for pSTAT3 and pERK expression. I Kaplan–Meier analysis was performed to evaluate the effects of pSTAT3 expression on overall survival (n = 301). J Kaplan–Meier analysis was performed to evaluate the effects of pERK associated with pSTAT3 expression on overall survival (n = 290). Group +/+: dual high expression level of pERK and pSTAT3; group +/−: high expression of pERK and low expression of pSTAT3 or low expression of pERK and high expression of pSTAT3; group −/−: dual low expression of pERK and pSTAT3.

