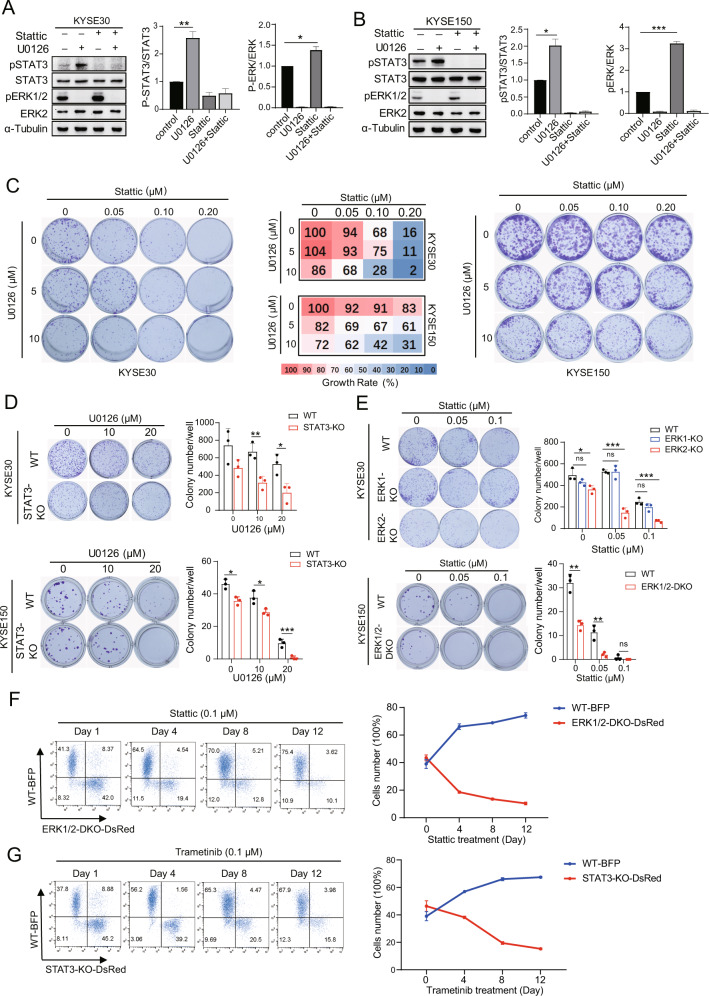
Fig. 3. Dual inhibition of ERK and STAT3 signaling decreases the proliferation of ESCC cells.
A, B Western blotting shows the expression of pSTAT3 and pERK in KYSE30 (A) and KYSE150 (B) after treatment with U0126 (5 μM) and/or Stattic (1 μM) for 4 h. Densitometry analyses of pSTAT3 or pERK expression are shown. Error bars represent the mean ± SD. *P < 0.05, **P < 0.01, ***P < 0.001. C Colony formation assays of KYSE30 and KYSE150 cells treated with a combination of U0126 and Stattic at different concentrations as indicated. The percentage growth at each inhibitor concentration is presented (middle). Data are presented as the mean of three independent experiments. D, E Colony formation assays of KYSE30 and KYSE150 STAT3-KO (D) and ERK1/2-KO (E) cells treated with U0126 at different concentrations, showing the colony formation number (means of three independent experiments). Error bars represent the mean ± SD. *P < 0.05, **P < 0.01, ***P < 0.001. F KYSE30 WT cells were stably transduced with EV-BFP (WT-BFP), and KYSE30 ERK1/2-DKO cells with EV-DsRed (DKO1/2-DsRed). Cells were mixed at equal numbers and treated with Stattic (0.1 μM). G KYSE30 WT cells were stably transduced with EV-BFP (WT-BFP), and KYSE30 STAT3-KO with EV-DsRed (STAT3-KO-DsRed). Cells were mixed at equal numbers and treated with trametinib (0.1 μM). Flow cytometry was performed to monitor the proportions of BFP + and DsRed+ cells at various time points. Shown are representative FACS plots from three independent experiments. Error bars represent the mean ± SD.

