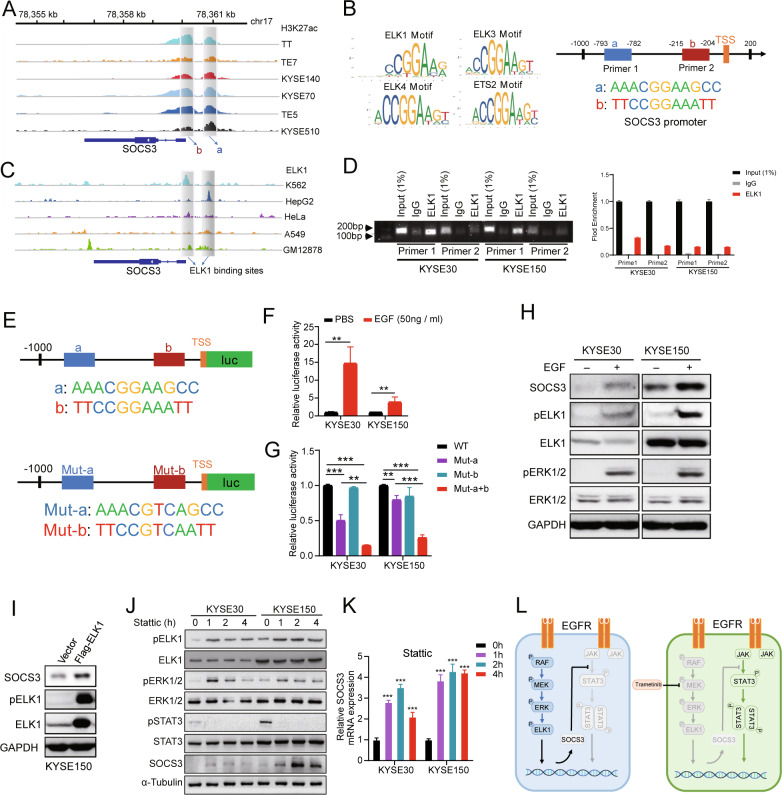
Fig. 5. SOCS3 is a downstream gene of the MEK/ERK/ELK1 signaling pathway.
A ChIP-seq analyses of six ESCC cell lines revealed H3K27ac signals at the SOCS3 locus. Shadows highlighting selected constitutive promoters of SOCS3 (a and b). B Predicted sequences of transcription factor motifs at the SOCS3 promoter determined using JASPAR. Predicted sequences of transcription factors ELK1, ELK3, ELK4, and ETS2. C ChIP-seq of ENCODE data for human malignant myeloid K562, human hepatoma HepG2, human cervical cancer HeLa, human lung cancer A549, and human B lymphocyte GM12878 cells revealed binding of ELK1 to the SOCS3 locus. Shadows highlighting selected constitutive promoters of SOCS3 occupied by ELK1. D ChIP-PCR analysis of ELK1 enrichment at the SOCS3 promoter in KYSE30 and KYSE150 cells. Shown are representative electrophoresis (up) and qRT-PCR (down) results of two independent experiments. Error bars represent the mean ± SD. E Schematic diagram of luciferase reporter plasmids which were constructed containing the wild SOCS3 promoter or mutant ELK1 motif. F KYSE30 and KYSE150 were transfected with the WT SOCS3 promoter-reporter. After 24 h, cells were treated with EGF (50 ng/ml) for 6 h and luciferase activity was evaluated. Error bars represent the mean ± SD. G Luciferase activity was evaluated in mutant ELK1 motif reporter-transfected cells after 24 h. Error bars represent the mean ± SD. *P < 0.05, **P < 0.01, ***P < 0.001. H Western blotting results show the phosphorylation of ELK1 and the expression of SOCS3 after EGF (50 ng/ml) treatment in KYSE30 and KYSE150 cells. I KYSE150 cells were transfected with Flag-ELK1 and SOCS3 expression was detected via western blotting. J Western blotting showed the expression of activated and total ELK1, ERK1/2, STAT3 and SOCS3 expression in KYSE30 and KYSE150 treated with Stattic in a time-dependent manner. K qRT-PCR results show the transcription level of SOCS3 mRNA after Stattic treatment at various time points. Error bars represent the mean ± SD. ***P < 0.001. L As in ESCC, EGFR signaling induced MEK/ERK activation but not STAT3 due to SOCS3 expression. MEKi caused SOCS3 downregulation and STAT3 was activated when EGFR signaling was induced.

