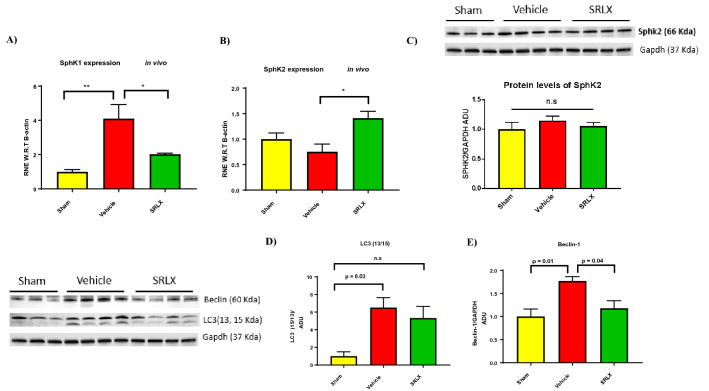
Figure 4.
Expression of SphK1, SphK2 and autophagy markers in mice treated with serelaxin. (A,B) SphK1 gene expression is significantly lower in animals treated with serelaxin. Contrastingly, SphK2 gene expression is significantly higher in animals treated with serelaxin (C) SphK2 protein (70 kDa) levels are not significantly different between the vehicle treated and serelaxin treated groups For (A–C) (n = 4 for vehicle and SRLX groups), one-way ANOVA was utilized, followed by Tukey’s post hoc analysis. (D) The expression of the cleaved, active form of LC3 (13 KDa) is significantly higher in the vehicle group (when compared to sham mice). Contrastingly, no significant difference in LC3-13/15 ratio was observed between the sham and serelaxin treated groups; (E) The expression of the autophagy marker Beclin-1 (60 kDa) is significantly lower in mice treated with serelaxin 28 days post MI. For (D,E) n = 4 for vehicle and SRLX groups and n = 3 for sham group. One-way ANOVA with Tukey’s post-hoc analysis was utilized. Western blots for figures (C) and (D) were obtained from the same gel blot, and utilize the same GAPDH band (37 kDa) as can be seen in (C) and (D).

