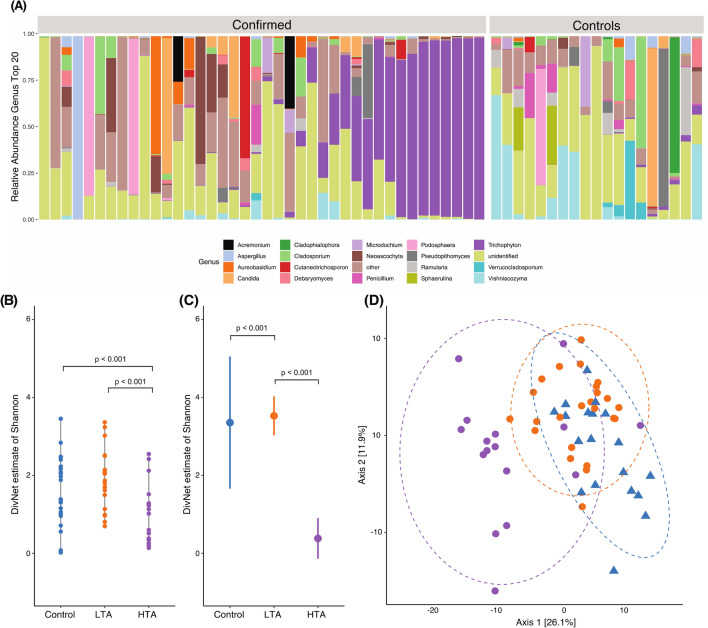
Figure 2.
Composition of toenail fungal communities. (A) The 20 most abundant fungal genera (average across samples) were selected for visualization The category others comprises all remaining genera Samples are depicted in cohort grouping of confirmed case- and healthy control samples Within those groups the samples were arranged based on the abundance of genus Trichophyton in order to visualize the found subdivision in the case group. (B) Alpha diversity in sample-wise estimates showed no difference between controls and LTA group Compared to the control group a significant decrease in Shannon diversity was observed (p < 0.001, decrease 0.8934, s.e. 0.1886) in HTA samples. (C) Estimated alpha diversity in community-wise comparison using Shannon The low Trichophyton abundance (LTA) group showed a significant increase in diversity compared to the healthy controls (p = 0.001, increase 0.1719, s.e. 0.0511) The high Trichophyton abundance (HTA) group had a significantly lower diversity compare to the control group (p < 0.001, increase 2.9728, s.e. 0.0652). (D) Principle coordinate analysis (PCoA) of case/control samples based on the Euclidian distance on PhILR transformed counts with blue triangles referring to controls, orange circles to LTA cases and violet circles to HTA cases Axis 1 capture 26.1% of the variation and separates the cases into two distinct groups.

