
Figure 2: Physical Component Summary (PCS) Trajectories by Time Since Injury, Age at Injury, and Length of Stay.
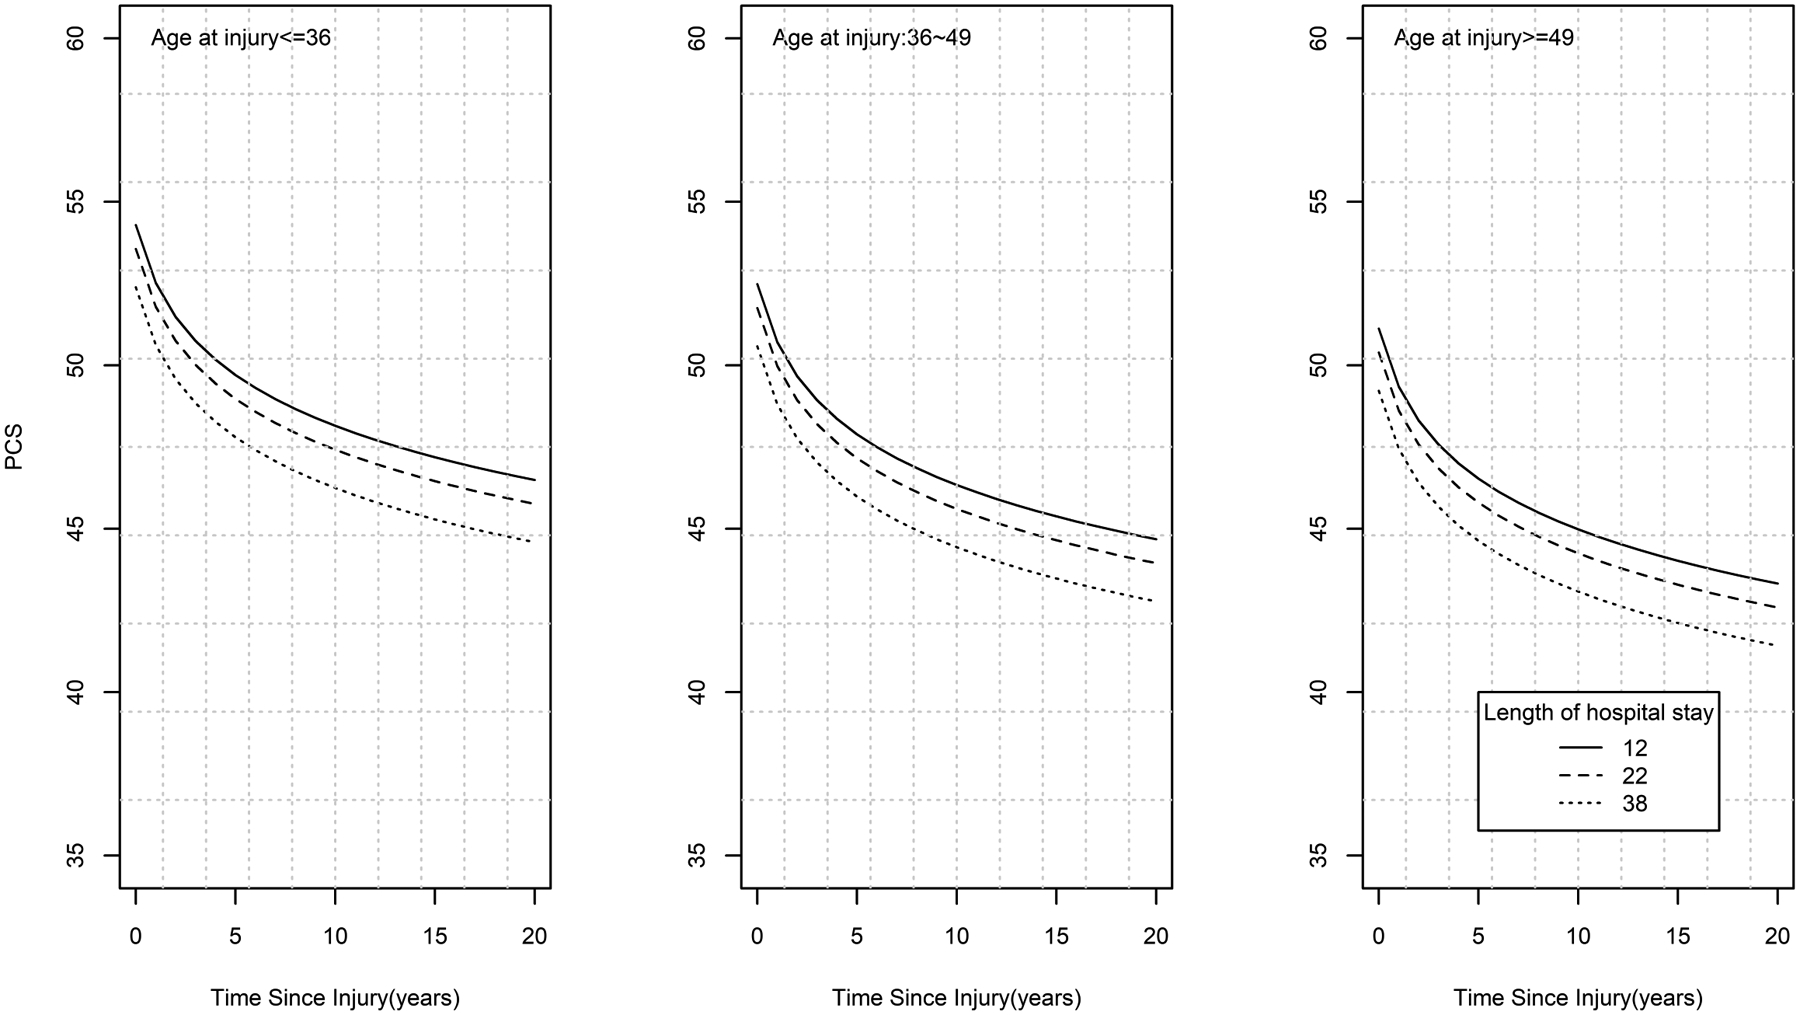
demonstrates that longer length of stay, older age at time of burn, and greater time since burn are associated with worse PCS scores. Longer hospital stays are associated with lower PCS scores across the three age groups. Trajectories across each age group show decreasing PCS scores over the duration of time since injury. Those with the longest hospital stays demonstrate greater worsening in PCS scores over the long term with a steeper change in the slopes initially. Age was categorized into 3 groups based on tertiles (<=36, 36~49 and >=49). Length of hospital stay was categorized into quartiles and the 25th (12 days), 50th (22 days) and 75th (38 days) percentile values are represented in the figure.