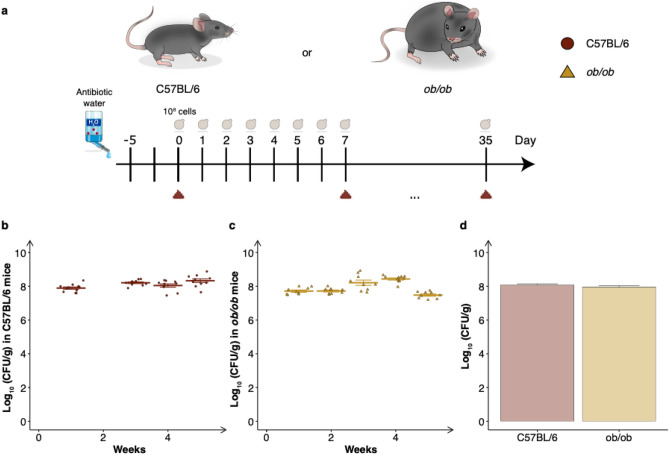
Figure 3.
Colonisation assessment of S. boulardii in two different mouse strains receiving antibiotic-treatment. (a) A graphical scheme of the study design. The mice were orally administered ~ 108 cells of S. boulardii daily for five successive weeks, with weekly faecal collection. (b) The time-course of log10 mean CFU/g of S. boulardii ± SEM over time (weeks) in faeces from C57BL/6 mice. (c) The time-course of log10 mean CFU/g of S. boulardii ± SEM over time (weeks) in faeces from ob/ob mice. (d) Bar plot of the mean CFU/g assessed in the faeces over the same period. Each dot represents the log10 CFU/g S. boulardii in one mouse.

