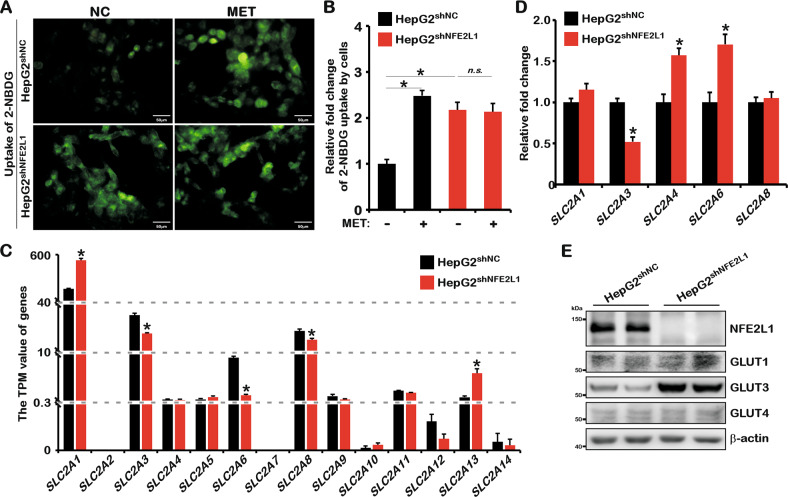
Fig. 3. NFE2L1 affect the uptake of glucose by HepG2 cells.
A HepG2shNC and HepG2shNFE2L1 cells were treated with metformin (MET; 1 mM) for 12 h and then incubated in serum-free medium containing 20 μM of 2-NBDG at 37 °C for 10 min and the green fluorescent images were achieved by microscopy, the scale is 50 μm. B The statistics show the results in (A). C Transcripts Per Million (TPM) value of SLC2A1, SLC2A2, SLC2A3, SLC2A4, SLC2A5, SLC2A6, SLC2A7, SLC2A8, SLC2A9, SLC2A10, SLC2A11, SLC2A12, SLC2A13, and SLC2A14 genes related to glucose uptake by cells; data originated from transcriptome sequencing. D Expression of SLC2A1–9 genes in HepG2shNC and HepG2shNFE2L1 cells as detected by qPCR. SLC2A2, SLC2A5, SLC2A7, and SLC2A9 were not detected based on a lack of or extremely low expression, and β-actin was used as the internal control. E Expression of NFE2L1, GLUT1, GLUT3, GLUT4, and β-actin in HepG2shNC and HepG2shNFE2L1 cells as detected by western blotting. n ≥ 3, *p < 0.05, ‘n.s.’ means ‘not significant’.

