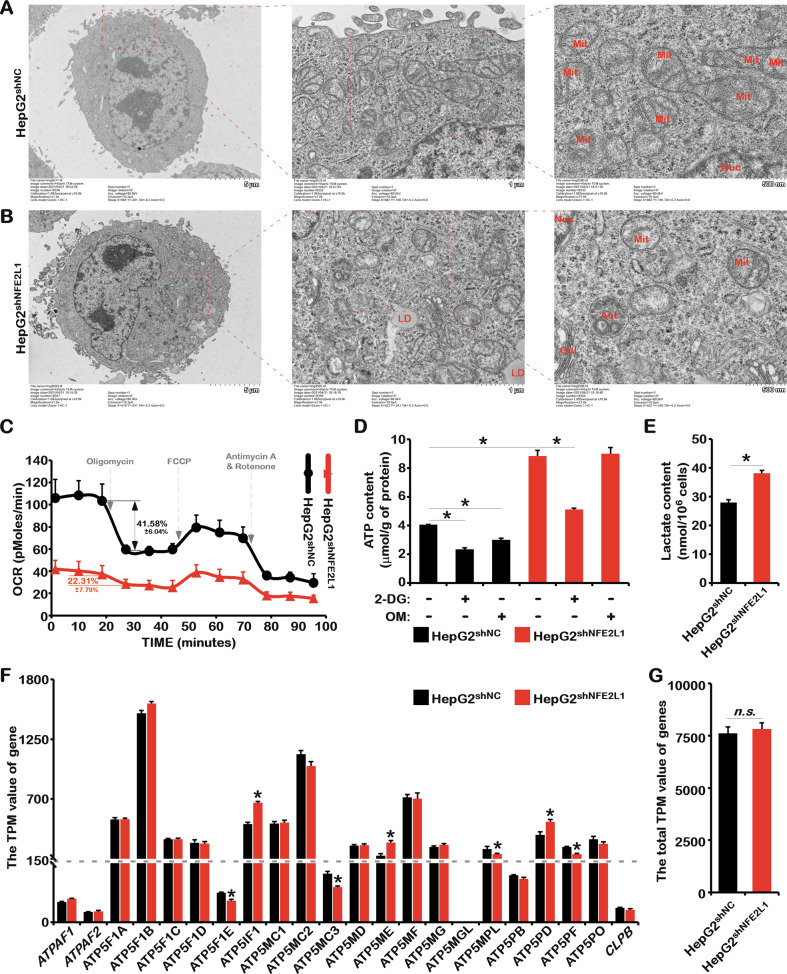
Fig. 5. The effect of NFE2L1 knockdown in HepG2 cells on the morphology and function of mitochondria.
The morphology of mitochondria in HepG2shNC cells (A) and HepG2shNFE2L1 cells (B) were detected by electron microscopy. C The oxygen consumption rate (OCR) of HepG2shNC and HepG2shNFE2L1 cells were measured with the Seahorse XF Cell Mito Stress Test Kit. D The HepG2shNC and HepG2shNFE2L1 cells were treated with 2-deoxy-D-glucose (2DG; 20 mM) or oligomycin (OM; 10 μM) for 12 h, and the content of ATP in cells were detected with an ATP assay kit. E The content of lactate in HepG2shNC and HepG2shNFE2L1 cells were detected with a lactic Acid assay kit. F The TPM values of ATPAF1, ATPAF2, ATP5F1A, ATP5F1B, ATP5F1C, ATP5F1D, ATP5F1E, ATP5IF1, ATP5MC1, ATP5MC2, ATP5MC3, ATP5MD, ATP5ME, ATP5MF, ATP5MG, ATP5MGL, ATP5MPL, ATP5PB, ATP5PD, ATP5PF, ATP5PO, and CLPB genes related to ATP synthesis in mitochondria in HepG2shNC and HepG2shNFE2L1 cells; data originated from transcriptome sequencing. G The total TPM values of genes in (F). n ≥ 3, *p < 0.05, ‘n.s.’ means ‘not significant’.

