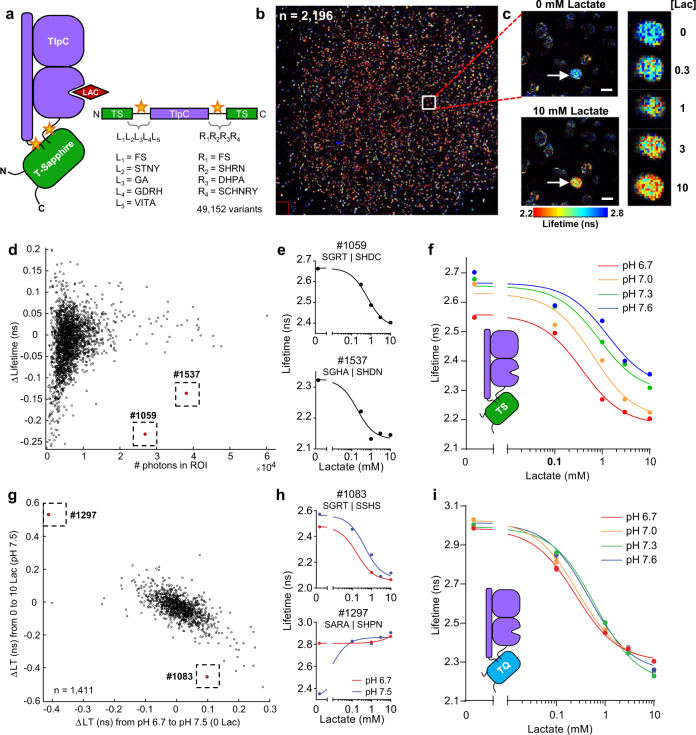
Fig. 3. Development and optimization of a high-performance lifetime sensor for lactate using BeadScan.
a Schematic of the lactate biosensor design. The lactate-binding domain of the TlpC protein was inserted into the fluorescent protein, T-Sapphire. The flexible linker regions (yellow stars) connecting the two domains were varied in a large biosensor library, sampling 49,152 biosensor variants. b ~10,000 GSBs containing the TlpC-TS lactate biosensor library were immobilized on a 1-cm2 glass coverslip inside a perfusion chamber. 2196 GSBs met the minimal fluorescence threshold for ROI detection. The stitched image is recreated from 121 individual frames recorded using 2p-FLIM. The white box marks a single frame (771 μm square). c One frame showing a single GSB (arrow) containing a biosensor variant that responded well to lactate. The biosensor displayed high fluorescence lifetime at low [lactate] and low lifetime at high [lactate]. Lifetime values are pseudocolored according to the heatmap at the bottom. Scale bars indicate 100 μm. d Initial screen of the TlpC-TS lactate biosensor library, showing data from individual biosensor variants captured in GSBs. Average photon counts within each ROI are plotted against the maximum change in lifetime between 0 and 10 mM lactate; each data point represents a single GSB. Two GSBs with large lifetime changes were selected (dotted boxes). e Dose-response curves from each of the two individual GSBs denoted in (d). f Performance of TlpC-TS #1059 at four different pH values. Dose-response curves were collected on a uniform sample of GSBs expressing TlpC-TS #1059 (n = 96 GSBs, mean ± SD). g Multiparameter screening of a linker library of TlpC-TQ, comparing lifetime changes in response to lactate versus pH for each of 1411 individual GSBs. Despite a general correlation between lactate- and pH-induced responses, rare variants that resisted this trend could be isolated (#1083). h Lactate dose-responses from each of the two individual GSBs denoted in (g) at pH 6.7 and pH 7.5. The pH-resistant variant (#1083, top) was renamed LiLac. i LiLac responses to lactate are highly resistant to changes in physiological pH. Data collected at room temperature using a uniform sample of GSBs expressing LiLac (n = 90 GSBs, mean ± SD). In (f, i), some error bars are occluded by the data points.

