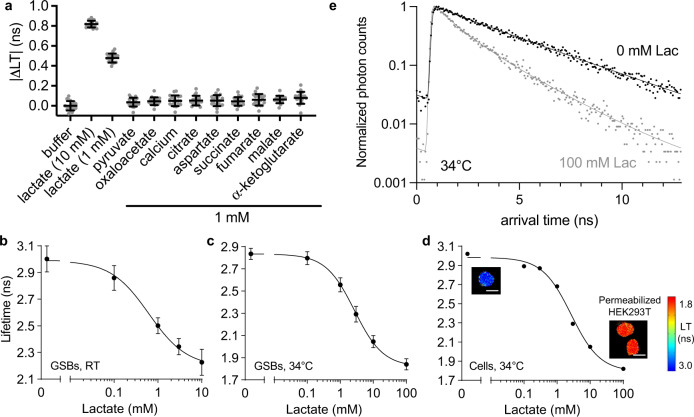
Fig. 4. LiLac is a sensitive, specific biosensor that reports on intracellular lactate concentrations.
a Specificity testing shows that LiLac displays a change in lifetime only when exposed to lactate. A uniform sample of GSBs expressing LiLac was exposed to 10 mM or 1 mM lactate, or 1 mM of each of nine other chemical compounds that may interfere with lactate biosensors (n = 19 GSBs, error bars are mean ± SD). | ΔLT | (ns) indicates the magnitude of the lifetime change relative to buffer. b A uniform sample of GSBs expressing LiLac was exposed to different lactate concentrations at pH 7.3 at room temperature (RT, n = 90 GSBs) or at c 34 ± 1 °C (n = 21 GSBs, mean ± SD plotted). d Biosensor calibration performed in permeabilized HEK293T cells at 34 ± 1 °C. Cells were permeabilized with β-escin in the presence of the lactate dehydrogenase inhibitor GSK-2837808A (2 µM), then imaged after exposure to different concentrations of lactate (4–12 cells per data point, mean ± SD). Insets of lifetime images of cells in 0 and 100 mM lactate depict fully permeabilized (swollen) cells. Pseudocoloring reflects empirical lifetime values according to the heatmap. Scale bars represent 20 μm. e Time-resolved single-photon arrival histograms for LiLac expressed in permeabilized HEK293T cells from (d), in the presence (gray dots) and absence (black dots) of lactate, each based on an image of a single cell averaged over 10 frames. Fit parameters for 0 mM lactate were A1 = 0.31, τ1 = 2.47 ns, A2 = 0.69, τ2 = 3.81 ns, Gaussian σ = 0.078 ns and χ2 = 1.09; and for 100 mM lactate they were A1 = 0.56, τ1 = 0.93 ns, A2 = 0.44, τ2 = 2.3 ns, Gaussian σ = 0.078 ns and χ2 = 1.11.

