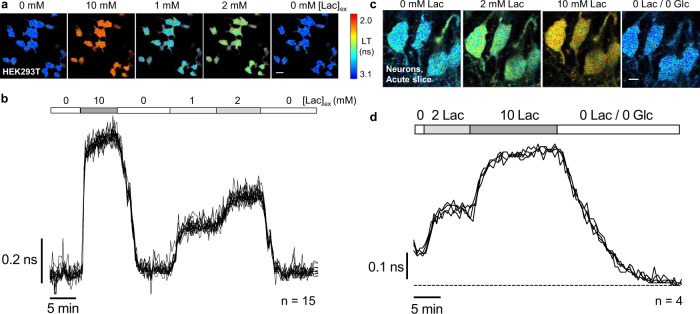
Fig. 5. LiLac reports on changes in intracellular lactate concentration in cultured mammalian cells and acute brain slice.
a Filmstrip of lifetime images showing intact HEK293T cells expressing LiLac at 34 ± 1 °C. Lifetime values are highly uniform across a population of cells exposed to a single concentration of lactate and are responsive to changes in lactate concentration in the external bath solution ([Lac]ex). Cells were incubated in 0 lactate/0 glucose prior to imaging. 20 μm scale bar. b Overlaid lifetime traces from each of 15 cells observed in (A) show that LiLac yields highly reproducible measurements of intracellular lactate concentrations across a population of cells and is sensitive to even modest manipulations of extracellular lactate (1 to 2 mM). Measurements recorded every 15 s. c Filmstrip and d single-cell traces from hippocampal neurons in acute slice expressing LiLac. Slices in 10 mM glucose were exposed to 0, 2 or 10 mM lactate, after which both lactate and glucose were washed out. Measurements recorded every 30 s. 15 μm scale bar. Images are pseudocolored by empirical lifetime values according to the heatmap, and traces indicate average lifetimes calculated over an 8 ns arrival time window (τ8).

