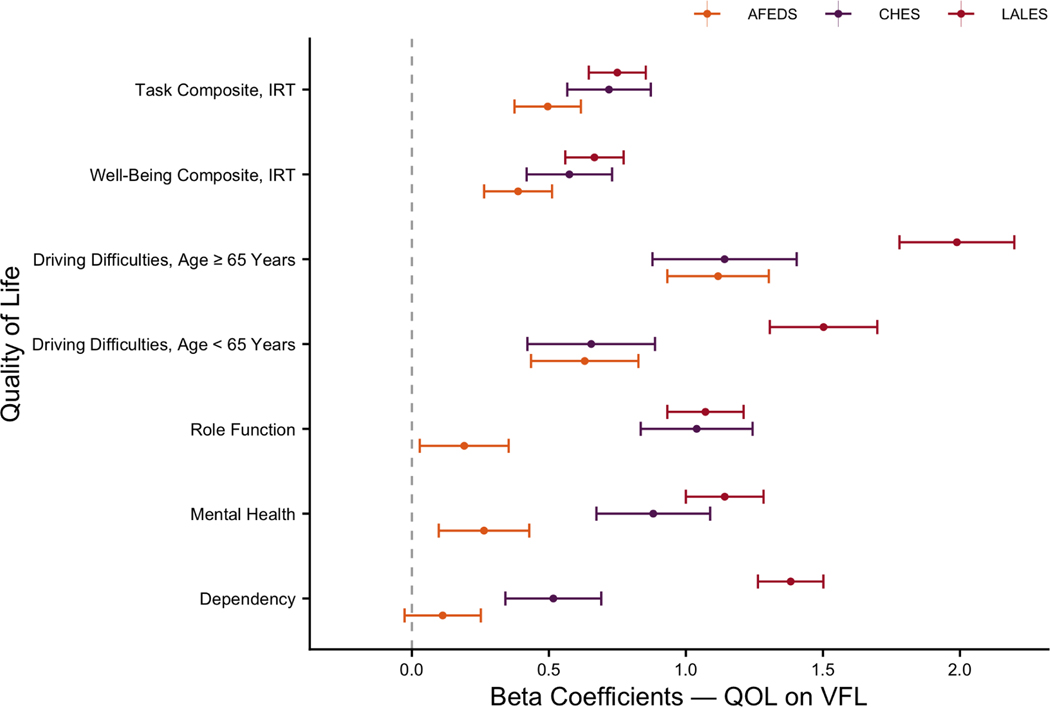
Figure 3:
Linear regression beta coefficients of NEI-VFQ-25 IRT and CTT on VFL (MD in dB) in the BSE by cohort LOWESS = Locally Weighted Scatterplot Smoothing; NEI-VFQ-25 = National Eye Institute Visual Function Questionnaire 25-ltem; IRT = Item Response Theory; CTT = Classical Test Theory; VFL = Visual Field Loss; MD = Mean Deviation; dB = Decibels; BSE = Better-Seeing Eye Linear regression models were adjusted for race and ethnicity, age, number of comorbidities, sex (female), born in USA (yes), education highest grade obtained), working status (unemployed), income (≤ $20,000), has health insurance (yes), presenting binocular visual acuity (LogMAR score), depression (a good bit of the time or more in the last 4 weeks), and an interaction between VFL and race, ethnicity.

