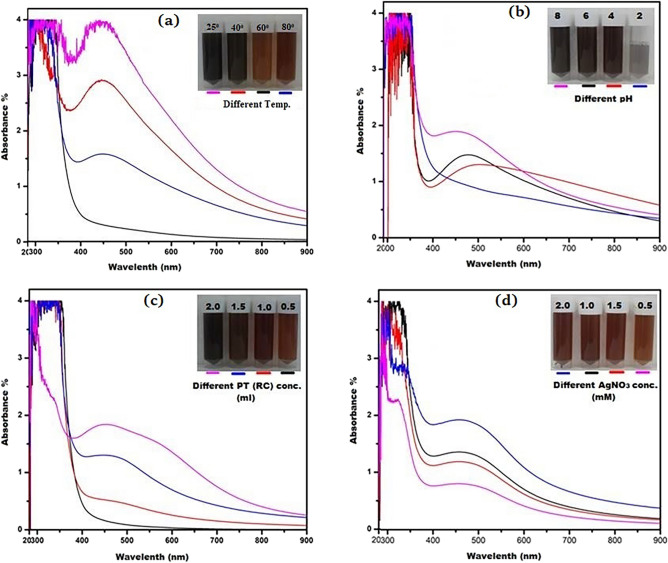
Figure 4.
(a) UV–vis spectra of RC@AgNPs: at different temperatures of 25, 40, 60, and 80 ºC; (b) at different pH of 2, 4, 6, and 8; (c) at different amount of RCLE i.e. 0.5, 1.0, 1.5 and 2 ml; (d) at different AgNO3 concentrations of 0.5, 1.0, 1.5, and 2.0 mM. (Except Fig. 4c, the remaining experiments had the same concentration of RCLE; Similarly, except Fig. 4d, the concentration of AgNO3 was the same in the rest of the experiments).

