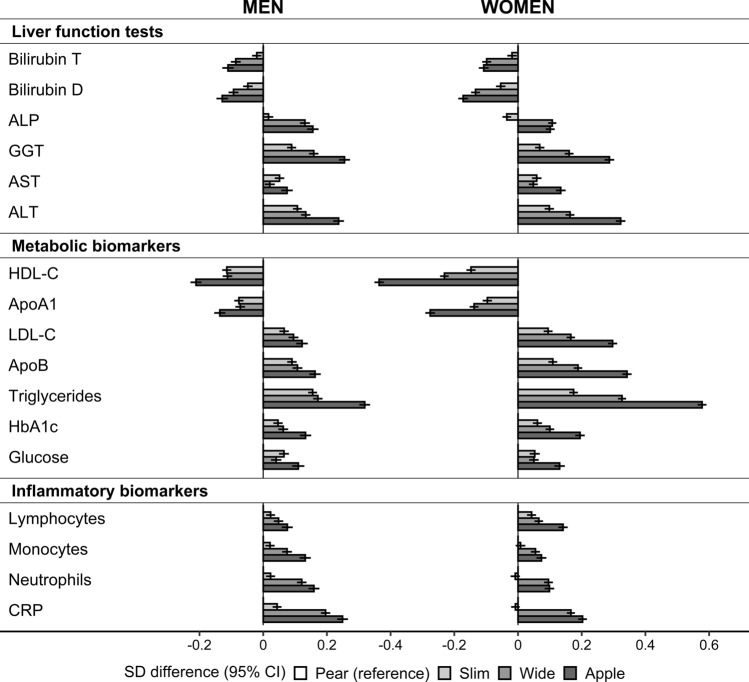
Figure 2.
Associations of biomarkers with body shape phenotypes. ABSI – a body shape index (cut-offs ≥ 80 for men, ≥ 73 for women); ALP – alkaline phosphatase; ALT – alanine aminotransferase; ApoA1 – apolipoprotein A1; Apo B – apolipoprotein B; Apple – large-ABSI-small-HI; AST – aspartate aminotransferase; Bilirubin D – direct bilirubin; Bilirubin T – total bilirubin; BMI – body mass index; CI – confidence interval; CRP – C-reactive protein; GGT – gamma-glutamyltransferase; HbA1c – haemoglobin A1c (glycated haemoglobin); HDL-C – high-density lipoprotein cholesterol; HI – hip index (cut-offs ≥ 49 for men, ≥ 64 for women); LDL-C – low-density lipoprotein cholesterol; Ly – lymphocytes; Neu – neutrophils; NW – normal weight (BMI ≥ 18.5 to BMI < 25 kg/m2); OB – obese (BMI ≥ 30 to BMI < 45 kg/m2); OW – overweight (BMI ≥ 25 to BMI < 30 kg/m2); Pear – small-ABSI-large-HI; SD – standard deviation; Slim – small-ABSI-small-HI; Wide – large-ABSI-large-HI. SD difference (95% CI) – estimates obtained from multivariable linear regression models including each biomarker (sex-specific z-scores, following log-transformation) as an outcome variable and, as independent variables, an ABSI-by-HI cross-classification, BMI categories, and covariates. Covariates included height, age at enrolment, weight change within the last year preceding enrolment, smoking status, alcohol consumption, physical activity, Townsend deprivation index, region of the assessment centre, time of blood collection, fasting time, use of nonsteroidal anti-inflammatory drugs, paracetamol use, and in women, menopausal status, hormone replacement therapy use, oral contraceptives use, and age at the last live birth. Numbers are shown in Supplementary Table S5. A likelihood ratio test comparing a model including BMI categories and covariates with a model additionally including the ABSI-by-HI cross-classification (evaluates the overall significance of body shape phenotypes) showed p < 1*10–6 for all biomarkers (p-values are shown in Supplementary Table S5).

