
Figure 4. MQ induces apoptosis in cultured A375-BRAFV600E/NRASQ61K melanoma cells, and oral administration blocks tumor growth in a bioluminescent murine model of intracranial BRAFi-resistant malignant melanoma.
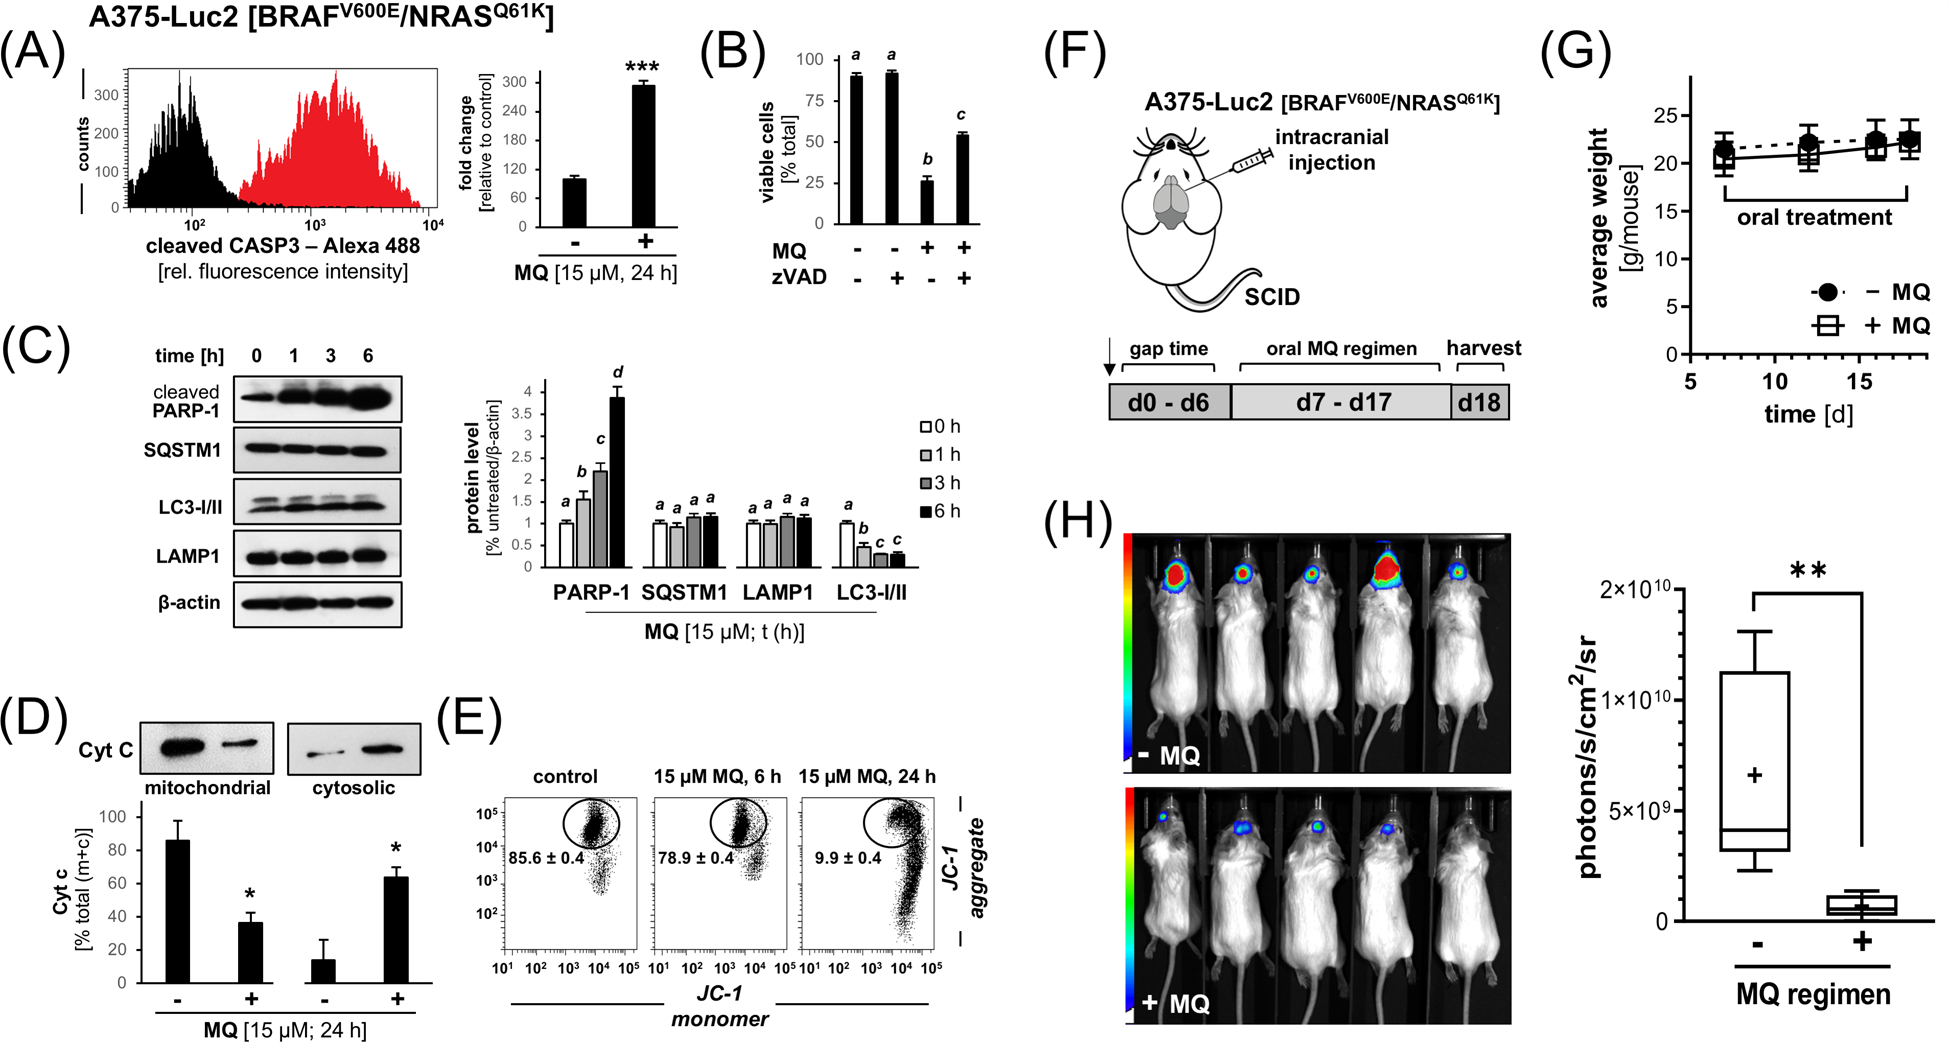
(A) MQ-induced (15 μM, 24 h) caspase-3 activation as examined in cultured A375-BRAFV600E/NRASQ61K cells by flow cytometric detection. (B) Cell death in A375-BRAFV600E/NRASQ61K melanoma cells exposed to the combined action of MQ (15 μM, 24 h) and the pan-caspase inhibitor zVAD-fmk (40 μM; mean ± SD]. (C) PARP-1 cleavage and modulation of autophagic-lysosomal mediators (SQSTM1, LAMP1, LC3-I/II) in response to MQ-exposure (15 μM, ≤ 6 h) in A375-BRAFV600E/NRASQ61K cells as assessed by immunoblot analysis (left panel); bar graph depiction summarizes densitometric analysis (right panel). (D) MQ-induced (15 μM; 24 h) cytochrome C release from cellular fractions (mitochondrial versus cytosolic). (E) Loss of mitochondrial transmembrane potential (Δψm) was assessed by flow cytometric analysis of JC-1 stained cells (15 μM; 6–24 h). Numbers indicate percentage of cells inside the circle displaying intact Δψm [mean ± SD; (p < 0.05)]. (F) Chemotherapeutic MQ-regimen in vivo: A375-Luc2 [BRAFV600E/NRASQ61K] melanoma cells were intracranially injected (n=5 per group) followed by bioluminescent image analysis of brain tumors on d1 (pair matching) and d18 (harvest). Starting on d7 after cell injection until d18, mice received MQ [50 mg/kg/d in H2O (10% DMSO; 200 μL via gavage)] or solvent control. (G) Mouse body weights as a function of treatment group and time (n=5 per group; d7–18). (H) Bioluminescent imaging (d18); bar graph (right panel) depicts quantitative image analysis of bioluminescent intracranial signal. Nonparametric data analysis (Figure 4H) was performed using the Mann–Whitney test (**p < 0.01). For all other bar graph depictions, quantitative data analysis employed ANOVA with Tukey’s post hoc test; means without a common letter differ from each other (p<0.05); for bar graphs comparing two groups only, statistical significance was calculated employing the Student’s two-tailed t-test (*p < 0.05; ***p < 0.001).