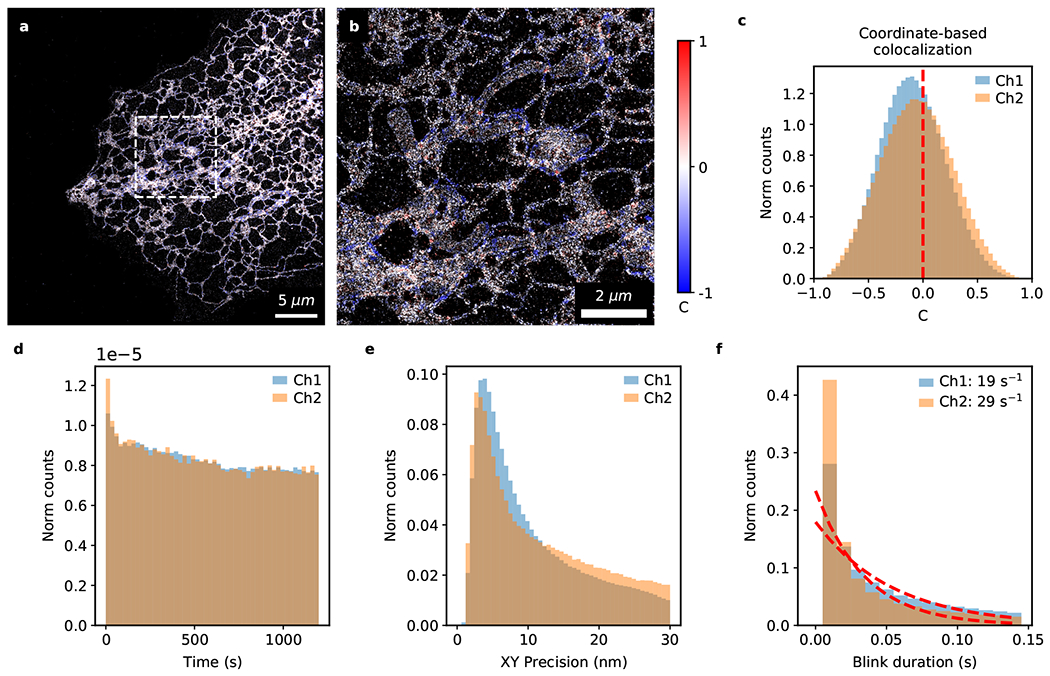
Extended Data Fig. 5. Analysis of fast 2-color fluorogenic DNA-PAINT imaging without optical sectioning.

Detailed analysis of the full 20-minute 2-color fluorogenic DNA-PAINT dataset from which Fig. 5 and Ext. Data Fig. 4 were generated. Image colored by the correlation parameter (C) based on Coordinate-Based Colocalization (CBC) analysis at low (a) and high (b) magnification. (c) Histogram of the correlation parameter, C. A value of zero indicates a lack of correlation between the two color channels (C = −0.09 ± 0.30; nblink=2,322,207; two-sided one-sample Wilcoxon signed-rank test against zero, T-statistic=9×10¹¹, p<0.001). (d) Minimal bleaching is observed over a 20-minute timeframe (~20%). (e) The lateral localization precision peaks at < 5 nm for both channels. (f) Blink durations fitted with an exponential decay function to estimate the binding off-rate (blinks that are only 1 frame in duration were ignored for fitting).
