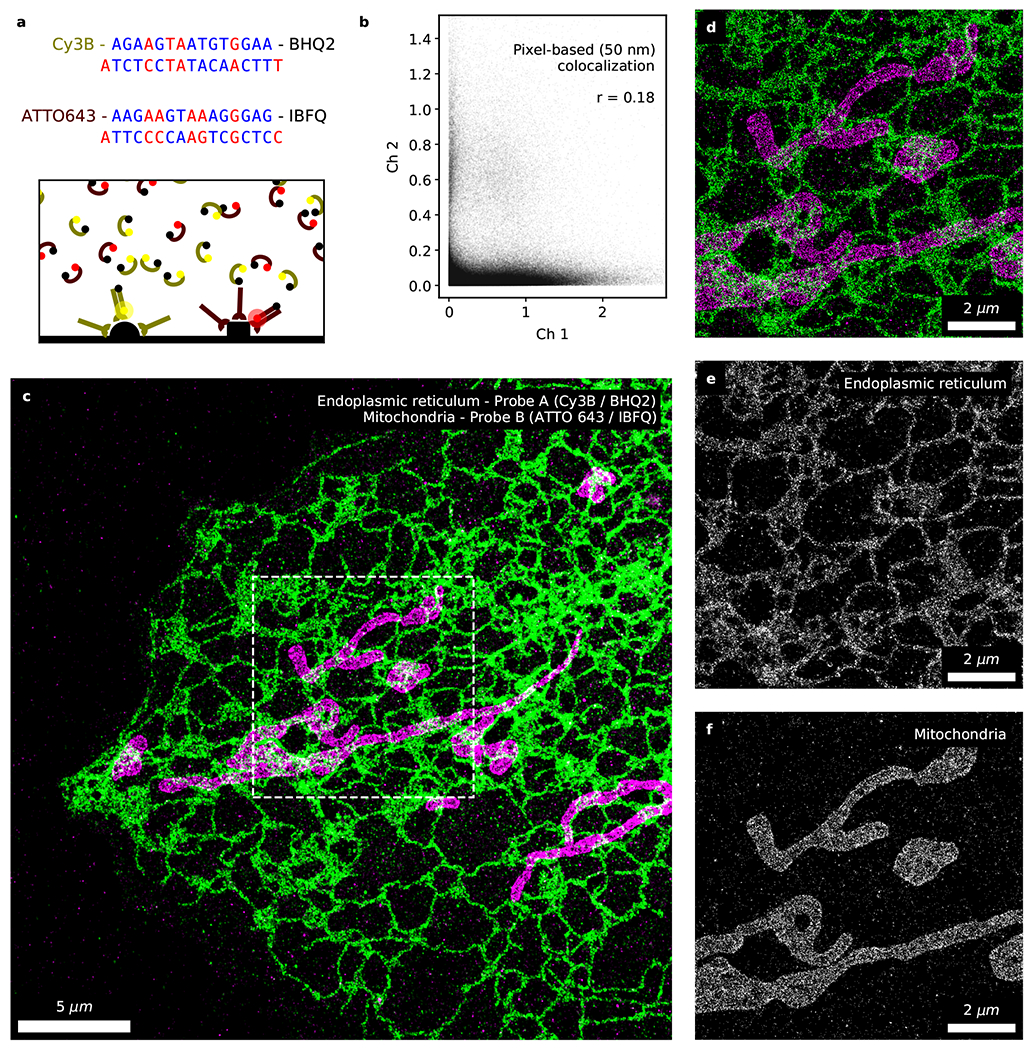
Figure 5. Fast 2-color fluorogenic DNA-PAINT imaging without optical sectioning.

Simultaneous 2-channel DNA-PAINT imaging with fluorogenic probes ([imager probe A] = 10 nM and [imager probe B] = 1 nM; 100 Hz; 10 min) of immunolabeled endoplasmic reticulum (overexpressed Sec61β; green) and mitochondria (TOM20; magenta). (a) The two sets of fluorogenic imager probes and docking strands. Complementary bases between the imager and docking strands are marked in blue whereas mismatches in red. The two population of probes selectively binds to their corresponding docking strands during simultaneous 2-color imaging. (b) Analysis of the data rendered at ‘low’ resolution (50 nm) indicates a low level of correlation between the two channels (Pearson correlation coefficient=0.18, p<10−4, npixel=6.3×10⁵) and minimal cross-specific binding between the two sets of probes. Overview (c) and zoomed-in (d) image of the ER and mitochondria acquired with fluorogenic DNA-PAINT in 10 minutes under widefield illumination. (e, f) Direct comparison of the two channels reveals negligible levels of cross-talk. Additional 2-color fluorogenic DNA-PAINT datasets are shown in Ext. Data Fig. 6 (n=5).
