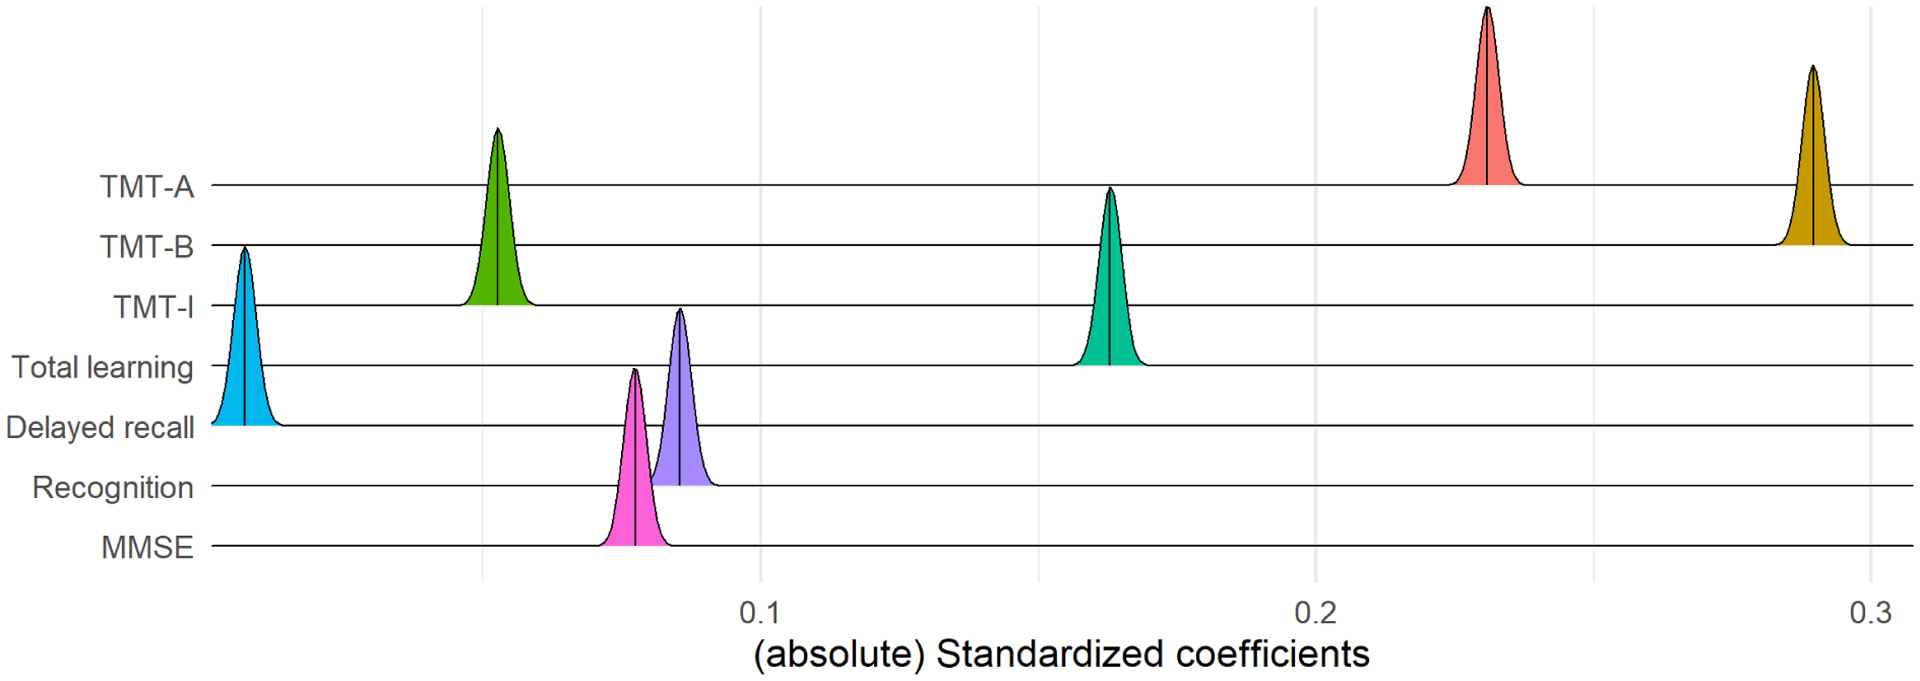
Figure 1.

Ridgeline plot showing the distribution of coefficients in the cognitive-age prediction model, across 1,000 permuted iterations within the ADNI sample. The vertical lines within the ridges represent their respective means. TMT= Trail Making Test; MMSE=Mini-Mental State Exam
