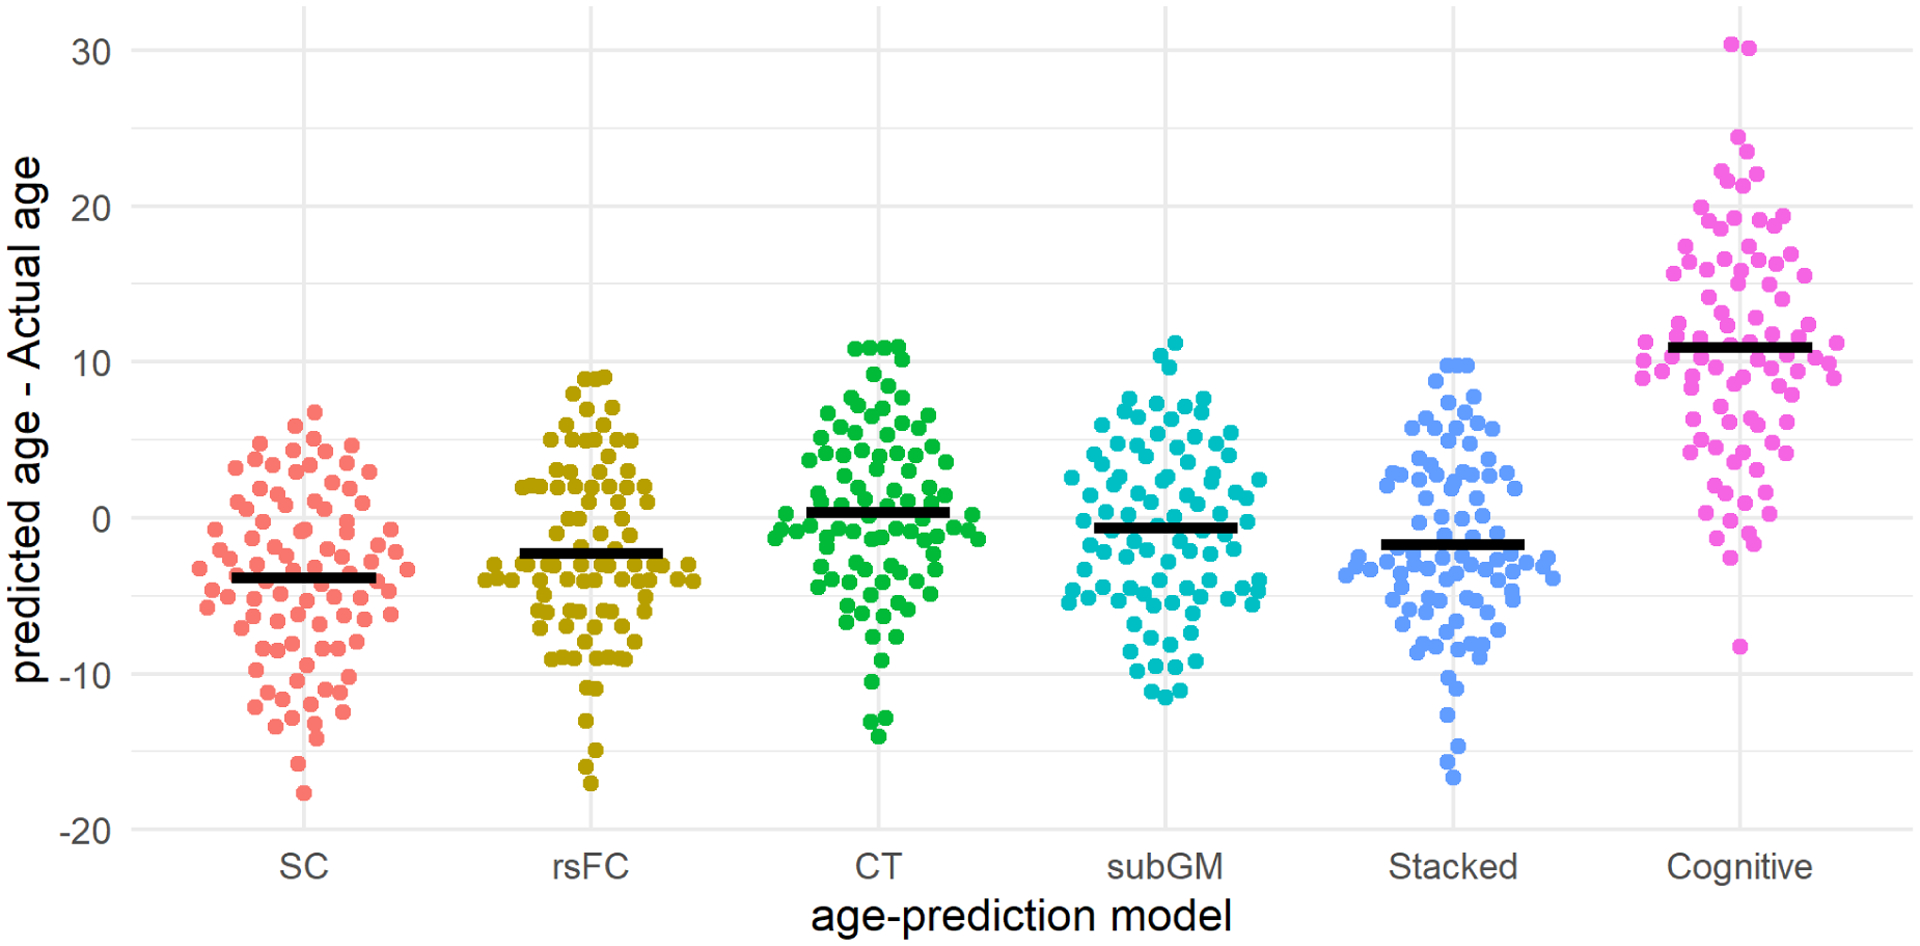
Figure 4.

Beehive plots showing the distribution of predict-actual age gaps across the different age-prediction models. The thick black lines represent the mean predict-actual age discrepancies in their respective age-prediction models. SC= structural connectivity; rsFC = resting state functional connectivity; CT= cortical thickness; subGM= subcortical gray.
