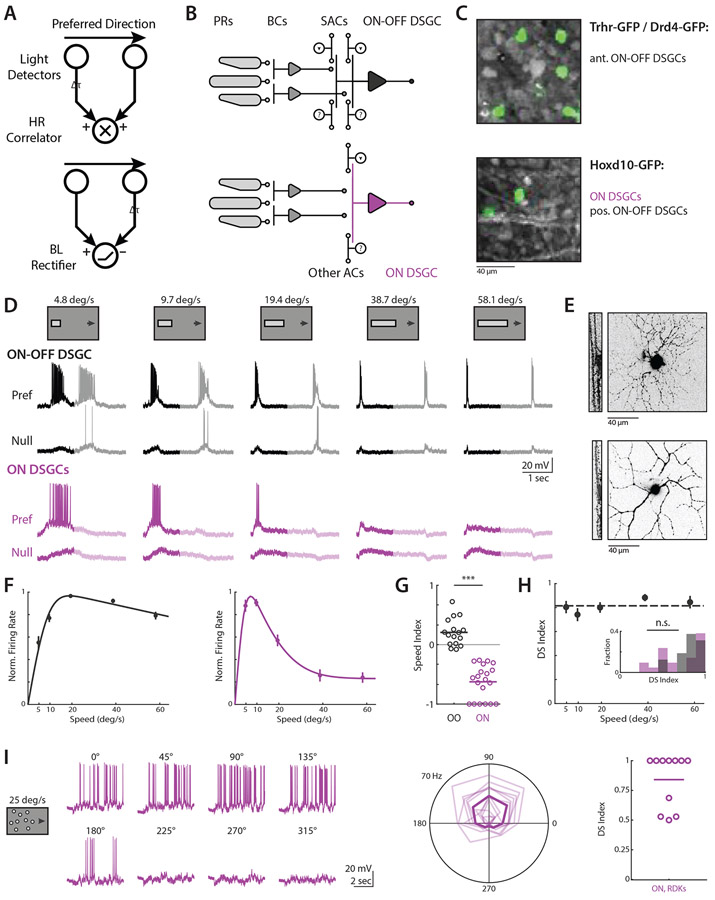
Figure 1. ON-OFF and ON DSGCs are directionally tuned independent of velocity.
(A) Mechanistic models of direction selectivity, (top) Hassenstein-Reichardt Correlator and (bottom) Barlow-Levick Rectifier. Both models depend upon comparing signals from spatially offset subunits with a differential time delay Δt. (B) Schematic of ON-OFF (black) and ON (purple) direction selective ganglion cell (DSGC) circuits. PRs; photoreceptors. BCs; bipolar cells. ACs; amacrine cells. SACs; starburst amacrine cells. (C) Fluorescent images showing GFP+ cells for targeted recordings. Trhr and Drd4-GFP mouse lines label anterior preferring ON-OFF DSGCs (top) while Hoxd10-GFP labels ON DSGCs and posterior preferring ON-OFF DSGCs (bottom). (D) Example ON-OFF (black) and ON (purple) DSGC current clamp recordings for elongated bar stimuli where bar length scales with speed. Opaque lines show analysis window restricted to On responses. (E) Example ON-OFF (top) and ON DSGC (bottom) TexasRed cell fills, showing xy projection (right) and xz ON and OFF layer bistratification (left). (F) Population-averaged velocity tuning curves of normalized peak firing rate. Error bars show standard error of the mean, solid lines show fits to an integral over difference of Gaussians. (G) Speed indices of current clamp spiking data for ON-OFF (black) and ON DSGCs (purple), compared via two-sided Wilcoxon rank-sum test; ***P = 3.6 x 10⁻⁷, 16 ON-OFF DSGCs in 11 mice, 21 ON DSGCs in 17 mice. (H) Population-averaged velocity tuning curve of DSI in ON-OFF DSGCs. Dashed line shows velocity-averaged DSI. Inset shows DSI histogram comparing velocity-averaged ON-OFF DSGC DSIs with ON DSGC DSIs at the velocities for which their firing rate is highest. Comparison was made via two-sided Wilcoxon rank-sum test, NS, P = 0.60, 16 ON-OFF DSGCs in 11 mice, 21 ON DSGCs in 17 mice. (I) (left) Example ON DSGC current clamp recordings for random dot kinetogram (RDK) stimuli moving coherently in one of eight directions. (Middle)Polar plot directional tuning curves of ON DSGCs spiking for RDK stimuli. Preferred directions are aligned to 90 degrees. Transparent lines are tuning of individual cells, bold line is population average. (Right) Direction selective indices computed from peak firing rate. See also Figure S1-S2 and Table S1.

