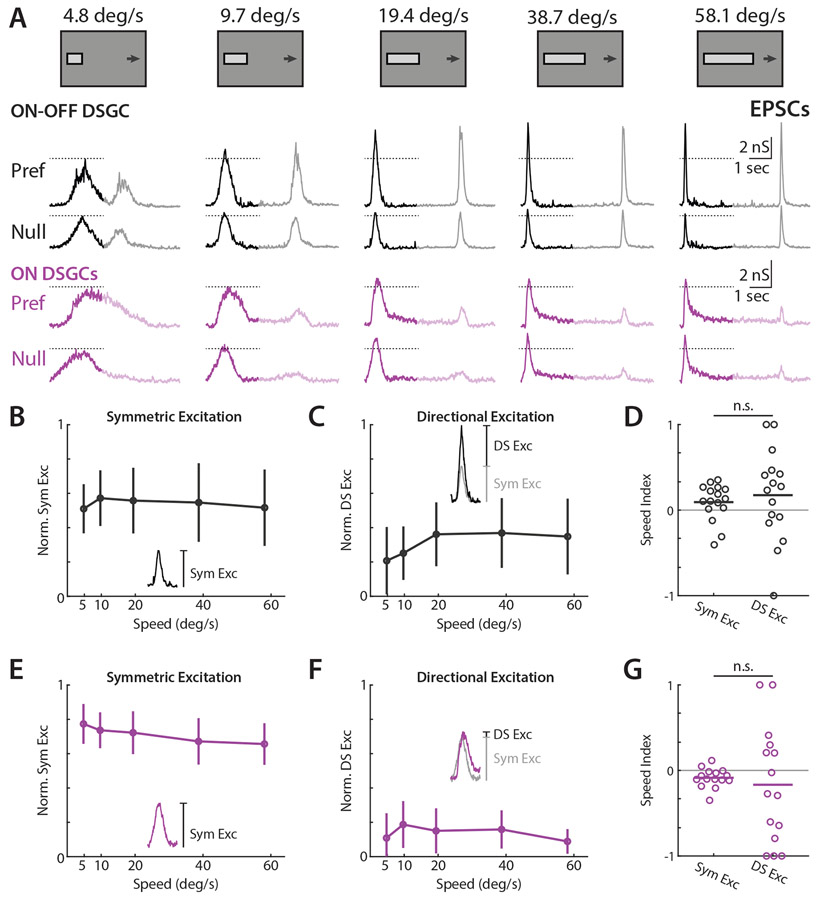
Figure 3. ON-OFF DSGCs receive significant directionally tuned excitation while ON DSGCs receive minimal directional excitation.
(A) Example ON-OFF (black) and ON (purple) DSGC EPSC recordings for drifting bar stimuli, flipped vertically for display purposes. Opaque traces shows analysis window restricted to ON responses. Dashed lines indicate EPSC amplitude at the lowest tested velocity. (B) Population-averaged velocity tuning curves of symmetric excitation normalized to each cell’s maximal preferred direction EPSC. Error bars show standard deviation. Inset shows measurement of symmetric excitation as amplitude of null direction EPSC. (C) Population-averaged velocity tuning curves of directional excitation normalized to each cell’s maximal preferred direction EPSC. Error bars show standard deviation. Inset shows measurement of directional excitation as amplitude difference of preferred minus null direction EPSC. (D) Speed indices of symmetric and directional excitation. EPSC speed indices were compared via two-sided Wilcoxon signed-rank test; NS, P = 0.12, 16 cells in 10 mice. (E-G) Same as b-d, but for ON DSGCs. ON DSGC EPSC speed indices were compared via two-sided Wilcoxon signed-rank test; NS, P = 0.60, 15 cells in 10 mice. See also Figures S2, S4-5 and Table S1.

